DXing DGPS Stations with Your Android or iPhone / iPad

Looking for a new set of stations to DX? You might want to consider DGPS stations, heard on the long wave band.

DGPS stations transmit the difference between positions indicated by GPS satellite systems and the known fixed position of the station. This allows higher accuracy. DGPS transmissions are 100 or 200 baud and are transmitted on frequencies from 285 kHz to 325 kHz. Hundreds of these stations are operated by the Coast Guard and other agencies, and they can be interesting DX targets.

A pair of apps allow you to decode these transmissions on your smartphone or tablet. There’s the Android version of DGPS decoder was well as the iPhone/iPad version of DGPS Decoder. It is also available for the Kindle Fire on the Amazon App Store.

I wrote a previous article about how to use MultiMode to decode these transmissions on your Mac.

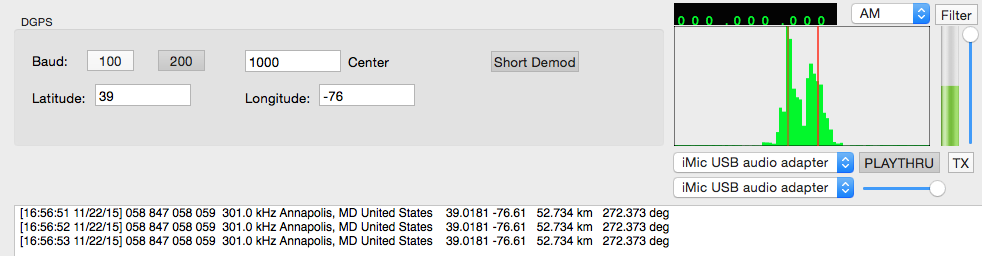
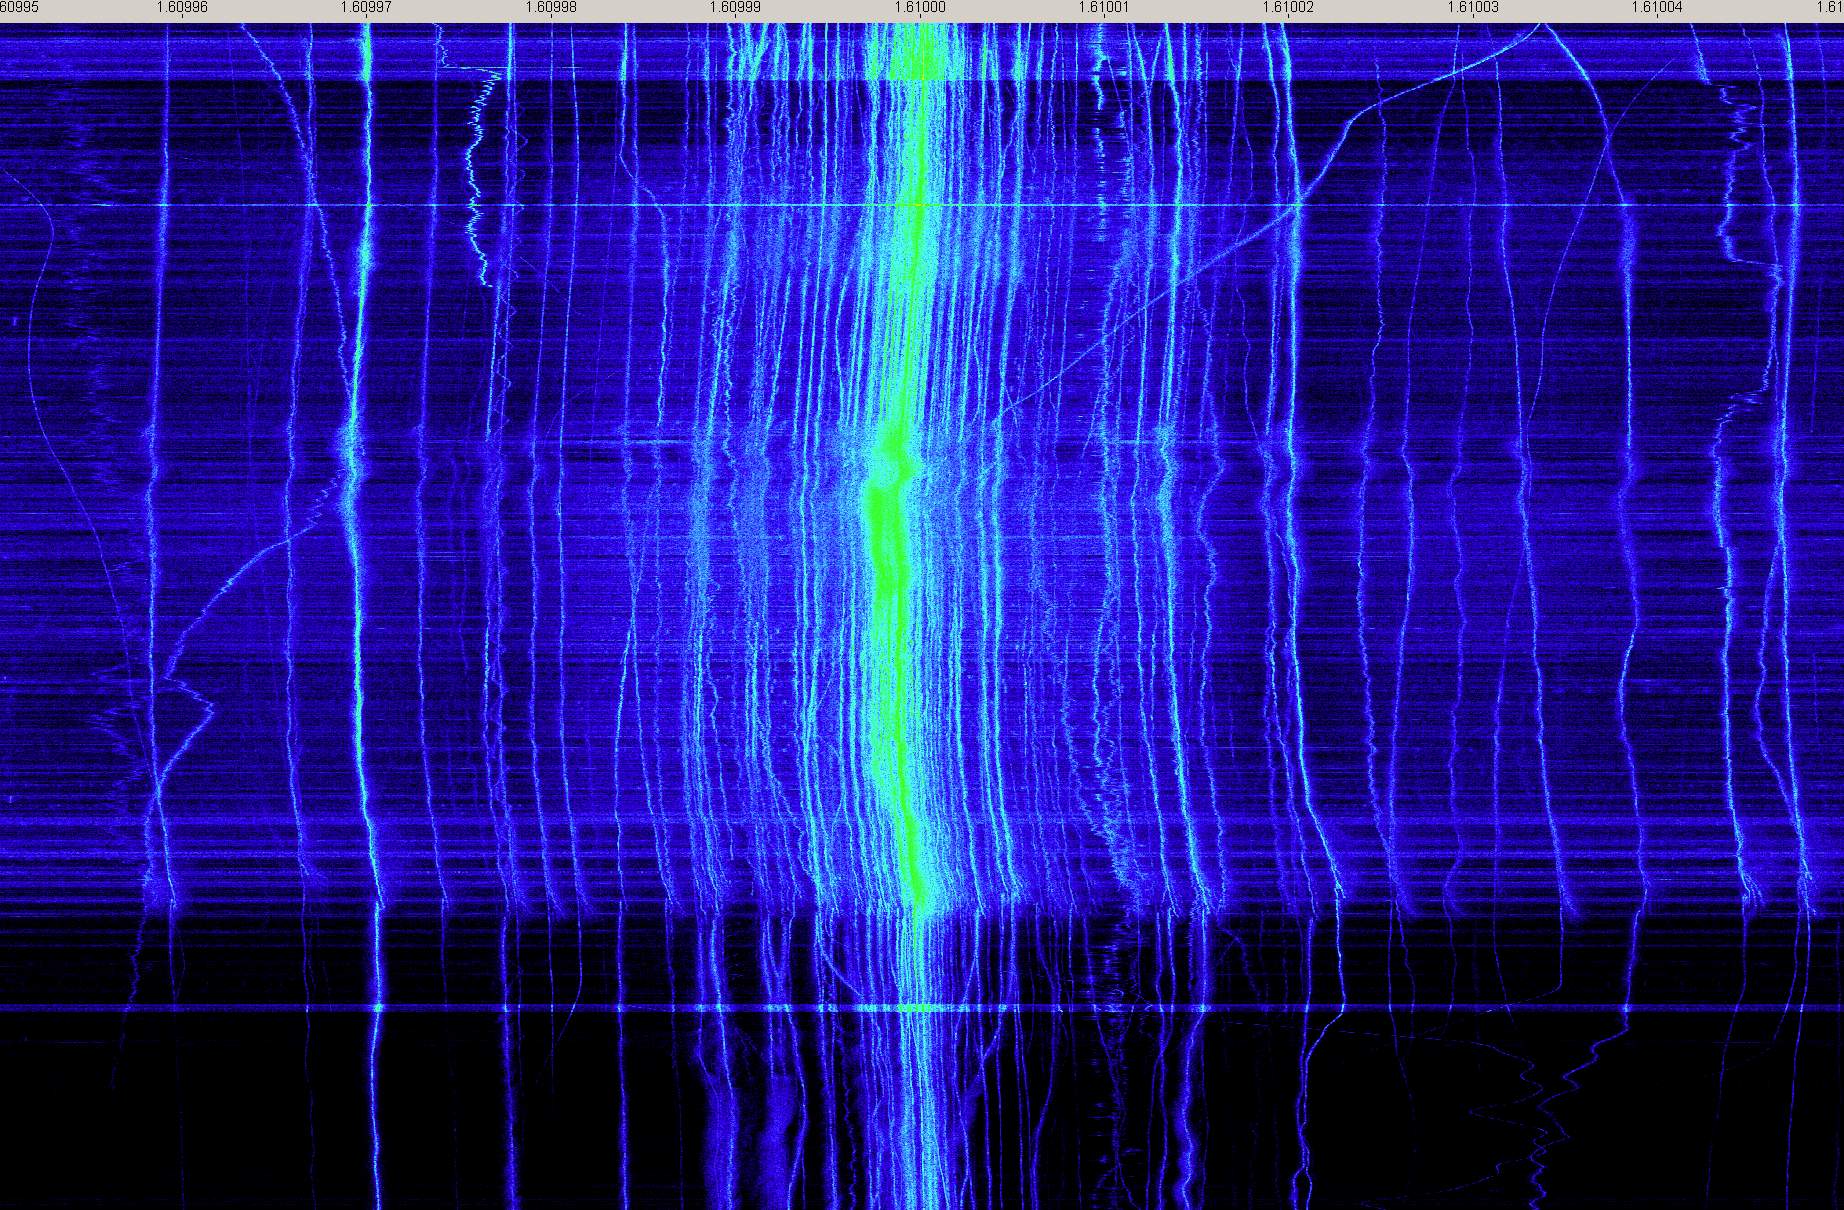
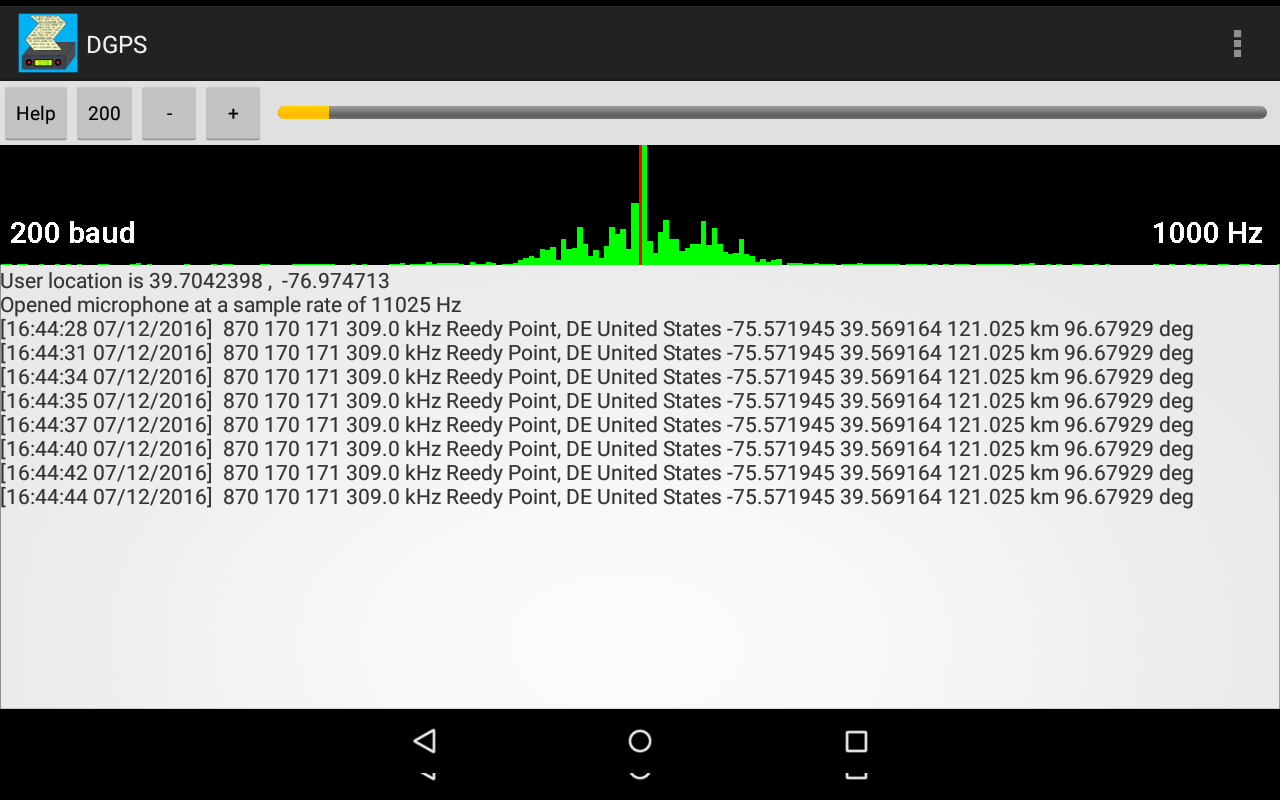
Here’s screenshots of the two apps in use, you can click on them to enlarge them:

You’ll need a radio that can tune the 285 kHz to 325 kHz range in SSB or CW mode. To decode the transmission, tune your radio to a DGPS frequency. You can either tune directly to the frequency in CW mode, in which case you set the center frequency in this app to frequency of the tone produced by your radio in CW mode, usually close to 800 Hz, or use USB mode, tune 1 kHz low, and set the center frequency in the app to 1000 Hz.

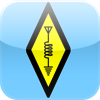
You can listen to an example DGPS audio recording, which you can also use to test out the apps, and practice correctly tuning in the transmissions, before trying for some actual stations on your radio. This example is 200 baud, with a center frequency of 1000 Hz.

A typical decoded message looks like this:

[23:24:00 08/08/16] 806 12 13 289.0 kHz Driver, VA United States 36.9633 -76.5622 306.61 km 172.711 deg

First the current UTC date and time are printed in brackets.
Then the station ID, 806 in this case, as well as the two reference IDs, 12 and 13 in this case.
That is followed by the assigned frequency, 289.0 kHz for this station. You can compare this value to what your radio is tuned to, they should match. If they don’t, then ignore this message, as it was incorrectly received. With weak signals, it is common to receive incorrect messages, because static or other interference has corrupted some of the bits. Just ignore them.
The location of the station is then displayed, the city, state, and country, followed by the station location.
Then the distance and bearing to the station is displayed, providing you have correctly set your location in the app.

Here’s a list of some stations I have previously received here with a modest 200 ft random wire antenna:

286.0 kHz Sandy Hook, NJ United States 40.4747 -74.0197 235.632 km
306.0 kHz Acushnet, MA United States 41.7492 -70.8886 529.571 km
305.0 kHz Dandridge, TN United States 36.0225 -83.3067 723.745 km
311.0 kHz Rock Island IL United States 42.0203 -90.2311 1245.06 km
289.0 kHz Driver, VA United States 36.9633 -76.5622 231.719 km
291.0 kHz Hawk Run, PA United States 40.8889 -78.1889 280.839 km
293.0 kHz Moriches, NY United States 40.7944 -72.7564 340.978 km
294.0 kHz New Bern, NC United States 35.1806 -77.0586 434.825 km
295.0 kHz St Mary's, WV United States 39.4381 -81.1758 448.281 km
297.0 kHz Bobo, MS United States 34.1253 -90.6964 1414.92 km
301.0 kHz Annapolis, MD United States 39.0181 -76.61 52.734 km
303.0 kHz Greensboro, NC United States 36.0694 -79.7381 463.251 km
304.0 kHz Mequon, WI United States 43.2025 -88.0664 1110.64 km
307.0 kHz Hagerstown, MD United States 39.5553 -77.7219 160.52 km
296.0 kHz St Jean Richelieu, QC Canada 45.3244 -73.3172 736.38 km
322.0 kHz St Louis, MO United States 38.6189 -89.7644 1190.3 km
292.0 kHz Cheboygan, MI United States 45.6556 -84.475 1013.8 km
314.0 kHz Card Sound, FL United States 25.4417 -80.4525 1560.45 km
288.0 kHz Cape Ray, NL Canada 47.6356 -59.2408 1650.3 km
290.0 kHz Louisville, KY United States 38.0175 -85.31 816.337 km
292.0 kHz Kensington, SC United States 33.4906 -79.3494 681.801 km
313.0 kHz Moise, QC Canada 50.2025 -66.1194 1464.05 km
302.0 kHz Point Loma, CA United States 32.6769 -117.25 3697.45 km

Receiving DGPS Stations with MultiMode For Mac OS X

   PSK31     
   iPad app to decode PSK31     

MultiMode for Mac OS X can decode DGPS (Differential Global Positioning System) transmissions. DGPS stations transmit the difference between positions indicated by GPS satellite systems and the known fixed position of the station. This allows higher accuracy. DGPS transmissions are 100 or 200 baud and are transmitted on frequencies from 285 kHz to 325 kHz. They can be interesting DX targets.

A copy of MultiMode can be downloaded here: http://www.blackcatsystems.com/download/multimode.html

To decode the transmission, tune your radio to a DGPS frequency. You can either tune directly to the frequency in CW mode, in which case you set the center frequency in MultiMode to that for your radio’s CW mode, or use USB mode, tune 1 kHz low, and set the center frequency to 1000 Hz.

You can listen to an example DGPS audio recording

Select the baud rate, either 100 or 200 baud, using the button. Also be sure to set your location so that the correct distance and bearing is calculated. Eventually, if you have tuned into a DGPS transmission that is strong enough, you will start seeing decode messages printed:

The Short Demod button can be toggled on, in which case MultiMode will look at a smaller part of the DGPS packet. This often allows decodes of weaker transmissions.

Note that since no error checking is performed on the packet, it is possible to get false decodes. To help determine if you are actually receiving the correct station, compare the printed frequency for that station to what your radio is tuned to, to verify they match. Also look for several decodes from the same station in a row, that indicates that you probably are really receiving that station.

Here’s a list of some stations I have received here with a modest 200 ft random wire antenna:

[15:44:47 11/19/15] 008 804 008 009 286.0 kHz Sandy Hook, NJ United States 40.4747 -74.0197 235.632 km 45.2895 deg
[19:27:49 11/19/15] 198 772 198 199 306.0 kHz Acushnet, MA United States 41.7492 -70.8886 529.571 km 53.1416 deg
[19:28:52 11/19/15] 190 782 190 191 305.0 kHz Dandridge, TN United States 36.0225 -83.3067 723.745 km 245.071 deg
[19:29:12 11/19/15] 156 863 156 157 311.0 kHz Rock Island IL United States 42.0203 -90.2311 1245.06 km 290.156 deg
[19:32:00 11/19/15] 012 806 012 013 289.0 kHz Driver, VA United States 36.9633 -76.5622 231.719 km 192.449 deg
[19:33:00 11/19/15] 184 788 184 185 291.0 kHz Hawk Run, PA United States 40.8889 -78.1889 280.839 km 319.079 deg
[19:33:24 11/19/15] 006 803 006 007 293.0 kHz Moriches, NY United States 40.7944 -72.7564 340.978 km 53.1725 deg
[19:33:37 11/19/15] 196 771 196 197 294.0 kHz New Bern, NC United States 35.1806 -77.0586 434.825 km 192.789 deg
[19:33:50 11/19/15] 092 843 092 093 295.0 kHz St Mary's, WV United States 39.4381 -81.1758 448.281 km 277.867 deg
[19:33:54 11/19/15] 136 792 136 137 297.0 kHz Bobo, MS United States 34.1253 -90.6964 1414.92 km 252.075 deg
[19:33:59 11/19/15] 058 847 058 059 301.0 kHz Annapolis, MD United States 39.0181 -76.61 52.734 km 272.373 deg
[19:36:40 11/19/15] 046 824 046 047 303.0 kHz Greensboro, NC United States 36.0694 -79.7381 463.251 km 226.48 deg
[19:40:01 11/19/15] 218 777 218 219 304.0 kHz Mequon, WI United States 43.2025 -88.0664 1110.64 km 298.697 deg
[19:41:11 11/19/15] 130 834 130 131 307.0 kHz Hagerstown, MD United States 39.5553 -77.7219 160.52 km 293.159 deg
[19:43:59 11/19/15] 312 929 312 313 296.0 kHz St Jean Richelieu, QC Canada 45.3244 -73.3172 736.38 km 16.5642 deg
[19:44:05 11/19/15] 154 862 154 155 322.0 kHz St Louis, MO United States 38.6189 -89.7644 1190.3 km 272.301 deg
[19:55:36 11/19/15] 112 836 112 113 292.0 kHz Cheboygan, MI United States 45.6556 -84.475 1013.8 km 319.521 deg
[20:32:19 11/19/15] 017 808 016 017 314.0 kHz Card Sound, FL United States 25.4417 -80.4525 1560.45 km 196.764 deg
[20:34:44 11/19/15] 340 942 340 341 288.0 kHz Cape Ray, NL Canada 47.6356 -59.2408 1650.3 km 49.1252 deg
[22:10:54 11/19/15] 168 869 168 169 290.0 kHz Louisville, KY United States 38.0175 -85.31 816.337 km 265.238 deg
[22:11:34 11/19/15] 192 778 192 193 292.0 kHz Kensington, SC United States 33.4906 -79.3494 681.801 km 207.126 deg
[22:20:26 11/19/15] 320 925 320 321 313.0 kHz Moise, QC Canada 50.2025 -66.1194 1464.05 km 28.7438 deg
[11:34:56 11/20/15] 262 881 262 263 302.0 kHz Point Loma, CA United States 32.6769 -117.25 3697.45 km 272.2 deg

An Afternoon in the 1230 kHz Graveyard

Below is a waterfall of 1230 kHz, captured with the netSDR. The recording starts just before 1700 UTC (at the bottom of the image) and runs until about 0030 UTC (top of the image), click on the image to expand it:

The total frequency width of the graph is 100 Hz, that is it extends +/-50 Hz from 1230 kHz. Now that I have the Rubidium Reference on the netSDR, I don’t have an issue with the radio itself drifting over time.

1230 kHz is a “graveyard” medium wave frequency in the US. There are six graveyard channels, 1230, 1240, 1340, 1400, 1450, and 1490 kHz. These channels were set aside as local channels by the North American Radio Broadcasting Agreement, which went into effect in 1941. The term graveyard comes from the weird mix of sounds often heard at night, as dozens of stations mix together. Graveyard stations are restricted to 1000 watts maximum, and some use well under that at night, sometimes under 100 watts.

As you can see by the graph, even at 1700 UTC (local noon) there are dozens of carriers present. Locally I have WRBS 33 miles away and WKBO 40 miles away. Within around 100 miles, there’s quite a few stations.

As it gets later and the D layer starts to go away, new stations appear, and the existing stations get stronger. At about 2200 UTC (5 PM local time) the background noise becomes more obvious as well.

Two of new carriers have an interesting sawtooth pattern to the carrier frequency.

The FCC requires a +/-20 Hz frequency accuracy for medium wave broadcast station carriers. It looks as though most if not all of the stations maintain that, it is impossible to say for sure what some of the outliers are, they could be MW stations or they could be a semi local QRM.

A Day In The Life of 1470 kHz

This waterfall was recorded from 1840 UTC January 3, 2011 to 1840 UTC January 4, 2011. The beginning of the recording is at the top of the image. It shows the carriers of MW radio stations on 1470 kHz. The width is 100 Hz, so frequencies +/-50 Hz from 1470 kHz are shown.

Click on it to open it full sized.

1470 kHz Waterfall

The red line you see in the center is the carrier of semi-local station WTTR. During the daytime it is the only audible station on 1470, although you can see that carriers for about 8 other stations are always present.

I’ve annotated several events with UTC times.

At about 2213 UTC you can see a sudden reduction in received signal strength, and the start of a drift in frequency. This is most likely due to a station switching to nighttime power levels. The change in transmitter power causes a change in temperature inside the transmitter, causing drift in the frequency. My suspicion is that it is WLOA from Farrel, PA, since they are supposed to switch at 2215 UTC.

At about 2252 UTC a carrier suddenly disappears. It is possible that this is KMAL from Malden, MO. They are supposed to shut down at 2300 UTC.

Note that these are hunches of mine, I am not 100% certain that these are the identified stations. These events do suggest that it may be possible to identify and DX stations based on carrier transients, if the actual times that the stations make the changes are known.

At 0400 UTC a carrier suddenly disappears. I am not sure who this could be. This would be 11 PM EST. The station started to fade in around 2300 UTC (6 PM EST). That suggests to me a station in the central US. I’m not sure why they would be shutting down at this late time of the evening, vs around sunset. Perhaps some more experienced MW DXers have some theories / candidates?

There’s also some transients in the morning.

First at around 1200 UTC (7 AM local time) you can see the received signal strengths of the distant carriers decrease. The Sun is rising, and the D Layer is forming again, attenuating MW skywave signals.

At 1230 UTC one of the carriers suddenly disappears. At 1251 a carrier appears.

At 1326, it looks like a a transmitter is changing power levels.

At 1406 UTC there is another transient on another carrier.

There’s also noticeable differences in the frequency regulation of transmitter carriers. Several of the carriers have a periodic cycling to the frequency. I thought is this is due to some temperature cycling in the transmitter.

The 1610 Zoo

Below is a waterfall centered around 1610 kHz in the extended MW (AM) Band, 100 Hz Wide (click on it to see an enlarged image): 1610 waterfall

1610 kHz is used by only two broadcast stations, both in Canada: CJWI in Montreal, and CHHA in Toronto. It is also, however, used by many TIS (Travelers Information Stations) stations, which broadcast traffic reports, weather, etc. These are low power stations, typically in the 10 watt range.

Locally, the dominant station on 1610 kHz is a TIS that relays NOAA weather transmissions, and is located somewhere in south central PA. I’ve never heard an ID.

This recording was made between about 2100 and 1700 UTC, you can see the increase in signal (and background) levels overnight, and then the weakening of the signals as the Sun rises and the D Layer reforms, attenuating distant stations. Looking at the waterfall, you can see dozens of carriers, each a different radio station. It’s interesting to note how many radio station signals are present, even during the daytime.

The horizontal lines are due to static bursts, and there’s some changes in the signal level due to the wind blowing around the antenna.

Some of the wandering of carriers you see that is in unison is due to drift of the A/D clock in the SDR. Other drift you see is due to the carriers themselves. Note that each major division at the top of the waterfall is only 10 Hz (and the entire width is 100 Hz) so there’s really only a few Hz total drift. Eventually I’ll get a more stable reference clock for the SDR, and receiver drift should go away.

Let’s have a contest. How many carriers can you count?