

The graph below shows the received signal levels of Radio True North, a pirate radio station from Canada, which transmitted on 6950 kHz on Mary 14, 2012. The signal faded in at around 0200 UTC, and the transmitter was switched off at 0702 UTC – that can plainly be seen on the chart:
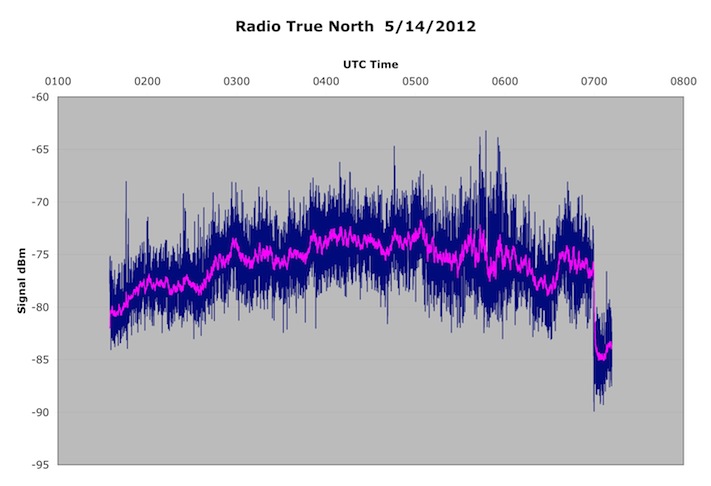
You can also see that after the transmitter switched off, the received signal levels were about -85 dBm, that is the background noise level. At peak, the signal was about -75 dBm, just a hair under S9. The signal to noise ratio is the difference between the signal and noise levels, or 10 dB.
Here is a short recording taken at around 0516 UTC, so you can hear what this signal sounds like. Remember, it is around S9, but the signal to noise ratio, which is what really matters, is only 10 dB. We had rain/thunder storms all along the east coast during this time.
Signal to noise ratios were discussed an earlier post, coincidently enough called Signal To Noise Ratios. There’s some simulated SNR recordings there. The 10 dB example sounds very close to the RTN recording above.
RTN was using his “usual power” (we’ll be vague and say a few hundred watts). Had he been using a lower power level, say 10 watts, the signal to noise ratio would have been about 0 dB, if not negative. He’s using a delta loop antenna, and is about 4,000 km (2,500 miles) away from my location.
Here’s a graph of RTN’s carrier frequency, as measured here:
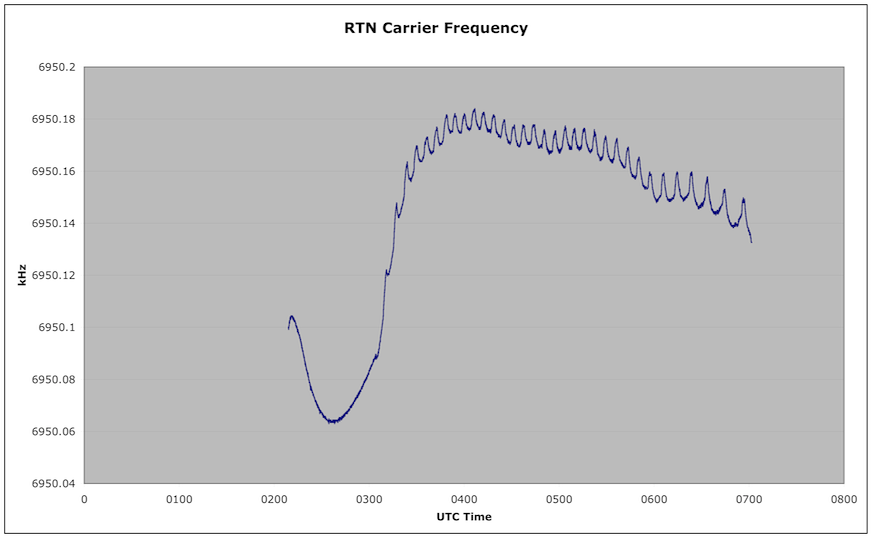
You can observe both the power on drift, and short term cycling (about every 10 minutes) due to most likely to something thermal, perhaps a fan.