Winter 2021-2022 Snowfall

High atop Parr’s Ridge in northern Carroll County, MD at about 850 ft elevation.

Monday November 29, 2021
Snow flurries.

Tuesday November 30, 2021
Snow flurries.

November Total: 0.0″

Monday December 27, 2021
1.0″ of snow

December Total: 1.0″

Friday January 7, 2022
6.0″ of snow


Sunday January 16, 2022
3.0″ of snow, then rain.

Monday January 17, 2022
0.5″ of snow

Thursday January 20, 2022
1.0″ of snow after rain

Friday January 28, 2022
About 1.0″, light snow all day.

January Total: 11.5″

Sunday February 13, 2022
5.8″ of snow

Monday February 14, 2022
1.0″ of dry puffy snow

February Total: 6.8″

Saturday March 12, 2022
5.5″ wet snow snow

March Total: 5.5″

Season Total: 24.8″

Winter 2020-2021 Snowfall

High atop Parr’s Ridge in northern Carroll County, MD at about 800 ft elevation.

October Total: 0.0″

Monday November 2, 2020
Snow flurries.

November Total: 0.0″

Tuesday December 1, 2020
Snow flurries.

Wednesday December 9, 2020
Snow flurries.

Monday December 14, 2020
Rain to snow, 1.0″ accumulation.

Wednesday December 16, 2020
Snow then sleet, measured 8.0″ accumulation the next morning.

Friday December 18, 2020
0.3″ dusting of snow.

Friday December 25, 2020
1.57″ of rain and then snow flurries, no accumulation.

December Total: 9.3″

Tuesday January 26, 2021
0.5″ of snow.

January Total: 0.5″

Sunday January 31, 2021 – Tuesday February 2, 2021
10.0″ of snow.

Wednesday February 3, 2021
0.25″ of snow.

Friday February 5, 2021
0.25″ of snow.

Sunday February 7, 2021
3.0″ of snow.

Thursday February 11, 2021
3.0″ of snow.

Thursday February 18, 2021
4.5″ of snow.

Friday February 19, 2021
0.5″ of snow.

Monday February 22, 2021
4.0″ of snow.

Saturday February 27, 2021
0.7″ of snow.

February Total: 26.2″

Tuesday March 16, 2021
Sleet in the morning, no accumulation.

March Total: 0″

Thursday April 1, 2021
0.1″ of graupel.

Friday April 2, 2021
0.1″ of snow.

Thursday April 22, 2021
Snow flurries.

April Total: 0.2″

Season Total: 36.2″

Northern Carroll County Snowfall

A comparison of the seasonal snowfall between here at my house (extreme north central Carroll County) and the COOP station in Millers (extreme northeast Carroll County).

We’re both at about the same elevation, Millers is 860 feet. I believe it is around 800 ft here at the house, although we have lots of nearby hills and valleys.

Comparing the seasons of common data, we seem to track each other very closely, so I think it may be a good proxy for my years of missing data, and gauging what the snowfall range is here from season to season. Miller’s has a mean snowfall of 34.1″.

Want to guess how much snow I’ll get this year? Enter the contest!

Season CDS Millers
2018-2019 37.8″” 35.3″
2017-2018 34.1″ 33.4″
2016-2017 22.9″ 19.6″
2015-2016 43.7″ 43.0″
2014-2015 44.7″ 47.7″
2013-2014 78.0″ 83.4″
2012-2013 30.2″
2011-2012 18.1″
2010-2011 35.5″
2009-2010 (Note 1) 87.6″
2008-2009 18.6″
2007-2008 18.0″
2006-2007 22.3″
2005-2006 28.0″
2004-2005 30.9″
2003-2004 37.5″
2002-2003 (Note 2) 67.4″
2001-2002 8.2″
2000-2001 29.4″
1999-2000 30.9″
1998-1999 25.7″
1997-1998 18.0″
1996-1997 22.2″
1995-1996 (Note 3) 80.5″
1996-1997 22.2″
1994-1995 12.0″
1993-1994 44.1″
1992-1993 50.2″
1991-1992 10.4″
1990-1991 23.3″
1989-1990 33.8″
1988-1989 13.3″

Note 1:
The infamous Winter Of 2009-2010. We had the three large blizzards, one in December (I recall 30″) and two in February (I recall 24-30″ each). Millers reports 29.9″ in December and 52.2″ in February.
After the February storms:


Note 2:
Millers reports 35.9″ in February 2003. We had a large snowfall here. Pictures:

Note 3:
My house was built Nov 1995 – May 1996. I remember visiting the construction site many times over the winter, and there was often snow.

Winter 2019-2020 Snowfall

High atop Parr’s Ridge in northern Carroll County, MD at about 800 ft elevation.

Contest!
Guess The Amount of Snow At Casa De Smolinski (and DCA/BWI/IAD)

Seasonal Snowfall Contest Entries

26.6	solarflair
29.7	cameraman  
30.5	Groveton  
34.3	Autumn Forge  
34.8	83worldtraveler  
35.7	Snownomore  
37.9	WGsnowchic   
42.4	Terpie Cat  
44.8	beadalou  
45.7	a. vagueanswer   
47.7	Kate commenting  
50.1	walter-in-fallschurch   
52.3	weatherjunkie   
54.5	eric654   
71.9	chrisofthebeagles  
77.7	merry mildest  
77.7	surewhynot  
120.1	The Adorable Miniature Snowplows  

October Total: 0.0″

Friday November 8, 2019
Morning snow flurries.

Sunday November 24, 2019
Morning snow flurries.

November Total: 0.0″

Sunday December 1, 2019
Sleet mixed with rain.

Monday December 2, 2019
Morning snow flurries. Some accumulation / dusting on the grass.

Wednesday December 4, 2019
Morning snow, 1.0″ accumulation


Wednesday December 11, 2019
Morning snow, 1.3″ accumulation


Monday December 16, 2019
Morning snow, 1.2″ accumulation

Wednesday December 18, 2019
Afternoon snow flurries, no accumulation.
“Snow Squall Warning” from the NWS around 8 pm, received 0.3″ of snow.

December Total: 3.8″

Tuesday January 7, 2020
Afternoon snow, 5.2″ accumulation

Wednesday January 8, 2020
Morning snow squalls (NWS warned), 1.2″ accumulation

Time lapse video of snowfall:

Video of squall:

Video 2:

Thursday January 16, 2020
Afternoon snow flurries.

Saturday January 18, 2020
0.2″ snow, then sleet and freezing rain.

Sunday January 19, 2020
Morning and afternoon snow flurries.

Friday January 31, 2020
Afternoon and evening snow mixing with rain, no accumulation.

January Total: 6.6″

Friday February 28, 2020
Snow flurries.

Saturday February 29, 2020
Snow flurries.

February Total: 0.0″

Friday April 10, 2020
Snow flurries.

2019-2020 Season To Date Total: 10.4″

Previous seasons:
Winter 2018-2019 37.8″
Winter 2017-2018 34.1″
Winter 2016-2017 22.9″
Winter 2015-2016 43.7″
Winter 2014-2015 44.7″
Winter 2013-2014 78.0″

Winter 2009-2010: No details, but the seasonal total was about 100″ with three major blizzards.

Winter 2018-2019 Snowfall

   HF Weather Fax     
   For Android     

High atop Parr’s Ridge in northern Carroll County, MD at about 800 ft elevation.

Contest!
Guess The Amount of Snow At Casa De Smolinski (and DCA/BWI/IAD)

Seasonal Snowfall Contest Entries

TSMagnum  26.9
Groveton  28.8
Snowbrow  35.2
mjbuffettfan  38
BigCountry  42.2
beadalou  42.3
Terpiecat  42.7
Xtrain21  44.4
ck5416  45.1
taylort2  45.8
(no name) 47.2
cdklktr  47.5
alrob8  48.3
Sneakyfeets  48.5
SSB  51.3
Sarandipity885  53.4
eric654  54.5
gelezinis vilkas  56.7
83worldtraveler  58.7
Kate commenting  59.3
asimovian  61.3
nomini  63.2
parksndc  64.7
I Love Terpiecat  65.0
cameraman  65.4
Snownomore  69.9
Autumn_Forge  67.3
chrisofthebeagles  71.9
Rex Block  73.3
Merry Mildest  75.0
walter-in-fallschurch  75.1
WBsnowchic  77
surewhynot  79
speedo311yo  88.0
PBH  88
Scrabble Girl   98.6
Chris Smolinski 100.0
The Adorable Miniature Snowplows  101

Mean: 61.0
Median: 59.3

(No, I can’t win my own contest, I thought it would to fun to add my own guess, which is just the approximate total snowfall the last time we had a solar minimum winter)

October Total: 0.0″

Thursday November 15, 2018 – Friday November 16, 2018:
7.0″ of heavy snow on the 15th.
An additional 1.25″ of snow measured early on the morning of the 16th, which fell overnight

Wednesday November 28, 2018
Snow flurries. No accumulation.

November Total: 8.25″

December Total: 0.0″

Wednesday January 9, 2019 – Thursday January 10, 2019
A dusting of snow.

Saturday January 12, 2019 – Sunday January 13, 2019
2.5″ of snow

Thursday January 17, 2019 – Friday January 18, 2019
1.5″ of snow

Saturday January 19, 2019
0.5″ of snow,then sleet, then rain.

Friday January 25, 2019
Morning snow flurries.

Tuesday January 29, 2019
3.5″ of fairly heavy snow.

Wednesday January 30, 2019
0.4″ from a snow squall.

January Total: 8.4″

Friday February 1, 2019
2.0″ of dry snow.

Monday February 11, 2019 – Tuesday February 12, 2019
5.5″ snow, ending as sleet and rain.

Sunday February 17, 2019 – Monday February 18, 2019
Glaze of freezing rain.

Wednesday February 20, 2019
4.5″ of wet snow, followed by some freezing mist. About 0.1″ ice build up on trees.

February Total: 12.0″

Friday March 1, 2019
2.9″ of snow.

Saturday March 2, 2019
1.5″ of wet snow, also some rain and sleet.

Sunday March 3, 2019
4.75″ of heavy snow.

March Total: 9.15″

2018-2019 Season To Date Total: 37.8″

Previous seasons:
Winter 2017-2018 34.1″
Winter 2016-2017 22.9″
Winter 2015-2016 43.7″
Winter 2014-2015 44.7″
Winter 2013-2014 78.0″

Winter 2009-2010: No details, but the seasonal total was about 100″ with three major blizzards.

Variation In Precipitation At Dulles International Airport (IAD) 1964-2017

   HF Weather Fax     
   For Android     

Previously I wrote about the variation In precipitation At Washington Reagan National Airport (DCA) and Baltimore Washington International Airport (BWI) to see if there was a significant change over the years due to Climate Change, and now it’s time to look at Dulles International Airport.

The IAD dataset starts later than that for DCA and BWI, and starts from April 1, 1960. As with the DCA and BWI data, there appear to be a few days with missing data, as for some years there is only data for 364 days. The actual number of days per year of data was taken into account when computing means. Also, large amounts of data are not available for various dates 1960 through 1963, and of course there is no data for the remainder of 2018. So the plots are from 1964 through 2017.

Each of the graphs can be clicked to be viewed full size.

The first graph is the average daily precipitation. This is total amount of rain per year divided by the number of days in the year. This graph shows a slight increase, from 0.110 to 0.115 inches per day:

Next is a graph of the number of days per year with precipitation, followed by its inverse, the number of days without. The number of days with precipitation has increased from about 114 to 121, or 6 more days. The increases at DCA and BWI were 5 days, and they was over a larger number years. It currently rains about 115 days per year at DCA, and 118 days per year at BWI.

This leads to the next graph, the average rainfall on days when it actually rained. There is no apparent change at all – this graph is flat. So while it rains about 6 more days a year at IAD, the amount of rain, on days when it does rain, is the same. Actually if you squint, it looks like it might be very so slightly decreasing, but it is subtle. And probably going to be different once you add in another year’s worth of data.

Next, we can look at the standard deviation in rainfall amounts on days when it rains, standard deviation is amount of variation of a set of data values around the mean (average). My previous post has a link for more information about standard deviation, as well as the best standard deviation joke for math nerds.

The standard deviation rose from about 0.48 to 0.50, about half the increase seen at BWI. By comparison, the standard deviation was unchanged at DCA. If you torture the data enough, you can find possible reasons for the change. I notice there was a step change / increase in the standard deviation from 2005-2014, which seems to have since stopped. You can also spot a period in the 1990s when the standard deviation was low. I am sure 20 people can find 20 more possible reasons. It’s like a Rorschach test for meteorologists. Here’s the standard deviation plot:

Finally, we can look at the number of days that rained and had rainfall over two standard deviations (using the standard deviation for that year), treating this as significant or extreme rainfall events. The trend of this is completely flat:

To summarize the analysis of rainfall events at DCA, BWI, and IAD:

  • The number of days with rain is increasing, 5 or 6 more days per year, over the last half century or more, at all three airports.
  • The average annual measured rainfall is either decreasing (DCA) or increasing (BWI, IAD), depending on which station you look at.
  • The average amount of rain on days when it does rain is either decreasing (DCA), increasing (BWI) or exactly the same (IAD).
  • The number of days with significantly high rainfall, exceeding two standard deviations, is either very slightly increasing (BWI) or unchanged (DCA, IAD), depending on which airport you look at.
  • Variation In Precipitation At Baltimore Washington International Airport (BWI) 1937-2018

    Previously I wrote about the Variation In Precipitation At Washington Reagan National Airport (DCA) 1945-2018 to see if there was a significant change over the years due to Climate Change, and now it’s time to look at BWI Airport.

    The BWI dataset starts earlier than tat for DCA, and runs from July 1, 1937 to July 18, 2018. As with the DCA data, there appear to be a few days with missing data, as for some years there is only data for 364 days. The actual number of days per year of data was taken into account when computing means. Also, some data is not plotted for 1945 or 2018, namely the number of days with/without rain for those years, as a full year of data is not available.

    Each of the graphs can be clicked to be viewed full size.

    The first graph is the average daily precipitation. This is total amount of rain per year divided by the number of days. It shows an increase from roughly 0.108 to 0.121 inches per day from 1939 to 2018. That’s an increase of about 12%.

    Next is a graph of the number of days per year with precipitation, followed by its inverse, the number of days without. The number of days with precipitation has increased from about 113 to 118, or 5 more days. This is the same increase we saw at DCA, although it seems rain about 3 fewer days per year at DCA vs BWI (You picked the right airport to leave near, Walter):

    That leads to the next graph, the average rainfall on days when it actually rained. This shows an increase from about 0.35 inches to 0.37 inches. (The trend at DCA was actually negative, from 0.37 to 0.35 inches in fact. Exactly opposite. Hmm…):

    Next, we can look at the standard deviation in rainfall amounts on days when it rains, standard deviation is amount of variation of a set of data values around the mean (average). My previous post has a link for more information about standard deviation, as well as the best standard deviation joke for math nerds. The standard deviation in rainfall amounts at BWI is increasing. Looking at the graph, the increase seems to be mostly due to an increase during the 2005-2015 period, which has since ended. Is it a short term variation due to random processes, or part of a long term shift?

    Next we can look at the number of days that rained and had rainfall over two standard deviations (using the standard deviation for that year), treating this as significant or extreme rainfall events. The trend of this is completely flat:

    But, you might ask, isn’t the standard deviation slightly increasing each year? What if we use a fixed standard deviation value, like 0.50 which seems to be the mean value? Doing that, you do see an increase from about 9 to 11 days per year:

    Next up… Dulles Airport (which unfortunately has the shortest dataset of all three major airports)

    Variation In Precipitation At Washington Reagan National Airport (DCA) 1945-2018

    Recently the weather, at least precipitation wise, in the DCA area has been variable. It was very wet and rainy, then we had dry conditions for several weeks with essentially no rain. Now, it is very wet again. Are we seeing extreme (some may say historic) changes in the weather? Or are these just the usual variations?

    Are rainfall events are becoming less common, but more extreme? That is, it rains less often, but we get more rain when it does rain, rather than getting rainfall spread out evenly over time as it used to be. And maybe we’re getting more rain overall. Or possibly less rain, those two claims seems to depend on recent weather memory.

    To check this claim, data for Washington Reagan National Airport (DCA) was downloaded from the NOAA NCDC site and analyzed in several ways. You can download this data yourself, if you wish: https://www.ncdc.noaa.gov/cdo-web/

    The dataset runs from July 1, 1945 to July 18, 2018. There appear to be a few days with missing data, as for some years there is only data for 364 days. The actual number of days per year of data was taken into account when computing means. Also, some data is not plotted for 1945 or 2018, namely the number of days with/without rain for those years, as a full year of data is not available.

    Each of the graphs can be clicked to be viewed full size.

    First, is there a significant long term trend in the amount of precipitation at DCA? No, there does not seem to be (if you squint you may see a very small decline over time, the sign of this slope likely changes from year to year with normal variability in rainfall):
    Mean daily precipitation

    Second, are rain events becoming less common, but with higher rainfall totals from those events? That would mean we are seeing fewer days with rain, but more rain on those days. The following two graphs show the number of days without any rain, and the number of days with rain, defined as 0.01″ or more. First the number of days without rain. Which is not increasing, but actually decreasing:
    Days per year without precipitation

    And the number of days per year with rain, which of course is just the inverse of the previous graph. It’s raining 5 or 6 more days per year (sorry, Walter):
    Days per year with precipitation

    Third, what about the rainfall totals on days when it actually rains. Is that increasing, leading to more extreme rain events? No, it isn’t. It is actually decreasing, which makes sense considering the mean rainfall per year is essentially steady, and it is raining a few more days out of the year:
    Mean precipitation for days with precipitation

    OK, maybe it is mostly the same, but we’re getting a few more extreme rainfall events per year? Let’s look at the standard deviation of the rainfall amounts, again only for days when it actually rains.

    Standard deviation is amount of variation of a set of data values around the mean (average), there is an explanation here: https://en.wikipedia.org/wiki/Standard_deviation If you get this joke, you understand standard deviation: “Yo mama is so mean she has no standard deviation”

    Hmm, no, that is also steady:
    Standard deviation of daily precipitation

    One more thing, look at the number of days with very extreme rainfall. How about the number of days where the rainfall exceeded two standard deviations? That also seems to be flat:
    Days above two standard deviations

    Anything else we can check to see if precipitation is indeed getting more extreme in Washington DC? So far, it doesn’t seem to be.

    Note, the purpose of this analysis was not to try and discredit man made climate change aka AGW, which is certainly real. Only to see if claims of a noticeable effect on the precipitation patterns in the DC area can be confirmed, which does not seem to be the case.

    Winter 2017-2018 Snowfall

       HF Weather Fax     
       For Android     

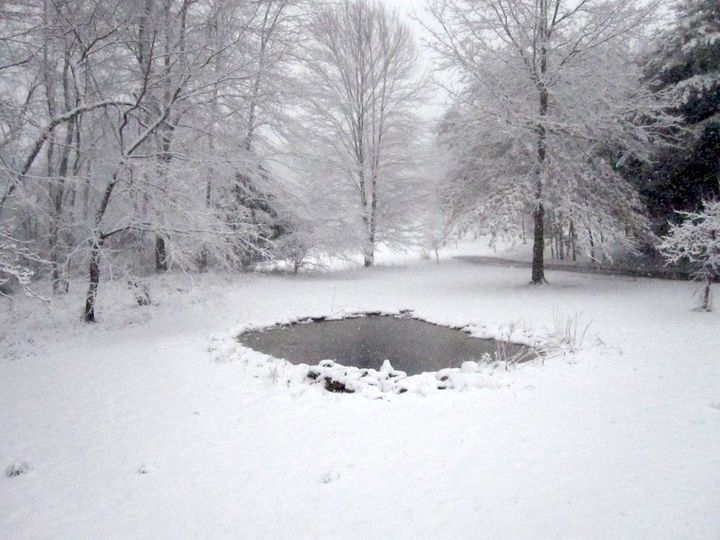
    On Parr’s Ridge in northern Carroll County, MD.

    Contest!
    Guess The Amount of Snow At Casa De Smolinski

    Seasonal Snowfall Contest Entries

    16	Snowbrow
    20.7	wadejg
    23.9	dcasey
    24.5	Squawks12
    24.9	Bob919
    29.2	SSB
    30	Takoma
    33.3	Merry Mildist
    36.8	83worldtraveler
    36.9	beadalou
    38	ubimea
    38.4	USAJerry
    38.5	Evann21
    40.8	Groveton
    41.1	I Love MetMet
    41.1	Rex Block
    41.3	taylort2
    41.7	PBH
    43.6	gelezinis vilkas
    44.4	SoCal SnowGal
    44.4	Xtrain21
    45.5	Rex Block
    46.2	Terpiecat
    47.325	Kate commenting
    50	walter-in-fallschurch
    51	huskerdont77
    51.4	BigCountry
    51.9	bachaney
    52.2	eric654
    52.4	gelezinis vilkas
    54.7	parksndc
    54.9	heroine.chic
    55.2	chrisofthebeagles
    55.9	heerokdas
    62.2	TominMichiganParkDC (*) late entry, not reflected in the mean/median values
    62.8	Lord Stark
    63.1	WGsnowchic
    66.0	--sg
    65.0	CalypsoSummer
    67.6	surewhynot
    68.8	wwashington postt
    81.3	hee hee
    

    Mean: 45.68″
    Median: 44.4″

    November Total: 0.0″

    Saturday December 9, 2017:
    3.5″ snow.

    Friday December 15, 2017:
    0.75″ fluffy snow.

    Sunday December 24, 2017:
    0.25″ Snow and sleet.

    Saturday December 30, 2017:
    2.0″ very dry snow.

    December Total: 6.50″

    Thursday January 4, 2018:
    0.9″ very dry snow.

    Monday January 8, 2018:
    0.25″ snow and sleet.

    Saturday January 13, 2018:
    0.25″ snow and graupel.

    Tuesday January 16, 2018:
    0.3″ snow.

    Wednesday January 17, 2018:
    2.0″ snow.

    Tuesday January 30, 2018:
    1.5″ snow.

    View post on imgur.com

    January Total: 5.2″

    Friday February 2, 2018:
    Snow flurries.

    Sunday February 4, 2018:
    2.4″ of heavy wet snow, followed by rain and some freezing rain.

    Wednesday February 7, 2018:
    Sleet, freezing rain (0.1 inch) and rain.

    Monday February 12, 2018:
    Some sleet in the morning.

    Saturday February 17, 2018:
    2.0″ wet snow.

    February Total: 4.4″

    Friday March 2, 2018:
    0.5″ wet snow, whipped by strong winds.

    Monday March 12, 2018:
    1.2″ snow.

    Wednesday March 14, 2018:
    Snow flurries.

    Thursday March 15, 2018:
    Snow flurries.

    Friday March 16, 2018:
    Snow flurries.

    Tuesday March 21, 2018:
    7.5″ snow.

    Wednesday March 20, 2018:
    8.3″ snow.

    Sunday March 25, 2018:
    Light snow flurries.

    March Total: 17.5″

    Monday April 2, 2018:
    0.5″ of snow after 0.43″ of rain.

    Monday April 9, 2018:
    Snow flurries/showers, no accumulation.

    Tuesday April 17, 2018:
    Snow flurries, no accumulation.

    Thursday April 19, 2018:
    Rain and some sleet mixed in.

    April Total: 0.5″

    2017-2018 Season To Date Total: 34.1″

    Previous seasons:
    Winter 2016-2017
    Winter 2015-2016
    Winter 2014-2015
    Winter 2013-2014

    Winter 2009-2010: No details, but the seasonal total was about 100″ with three major blizzards.

    Project: Exterminate Yellow Jackets

    For several years, yellow jackets made it extremely unpleasant, and often downright impossible, to enjoy sitting outside during the summer on the deck. As everyone who has experienced yellow jackets knows, these are extremely aggressive and downright hostile insects. While bees are generally peaceful and useful creatures, helping to pollinate, yellow jackets don’t pollinate, and are generally pure evil. My goal now every spring is to do my best to completely eradicate them from the area. Many of the yellow jackets found in the United States are not even native, but invasive species from Europe, if you need additional incentive to obliterate them. Again, to repeat. Yellow jackets are mean and nasty wasps. They do not pollinate flowers and help fruit grow. They are not critical to the ecosystem of your back yard. You can do your best to completely eradicate them from your yard, and feel no guilt doing so.

    Most people wait until they are being bother by yellow jackets to put up a trap or two in the summer. By then, it is far too late. Yellow jacket nests can have several thousand wasps by mid summer, and you may well have multiple nests in or near your yard. It is simply impossible to trap them all by this time, in fact their nests will probably increase in population faster than you can trap and kill them. You’ll find it impossible to sit outside and enjoy summer, being forced to hide inside and watch reruns of old TV shows.

    But it turns out, there is a solution. You need to act now. Yellow jacket nests are annual, only the queen survives winter. Once the weather warms up (as in right now) the queens emerge, to establish the new nests for this summer. While later in the season they have their evil minions to do their bidding, gathering food and generally making your life miserable, right now they have to do the dirty work. Which means this is your opportunity to trap and kill every single queen you possibly can. And it’s not that difficult to do.

    After experimenting with various commercial yellow jacket traps, most of which used expensive pheromone based lures that had to be replaced often, and often did not even work very well, I stumbled on this style trap made by Victor:

    The trap is a plastic bottle with a top that screws on. The top has small holes in it, under the yellow top (which keeps out the rain), which the wasps can fly into. But due to their erratic flying pattern, they have a difficult time escaping from the trap. So they are stuck inside, and finally die.

    I bait the traps with a grape juice / cranberry juice mix, I find this works best, although you can try plain grape juice or other juices, and see what works best for you:

    I pour a small amount of juice into each trap, this lures the yellow jackets into the trap, where their meet their demise:

    I purchased a dozen traps several years ago, and place them in various locations around the perimeter of my yard. You can probably get by with just a few, if you have a small yard. You do want to find the ideal locations to place them, which depends on where the likely yellow jacket nests are located. I find that placing them on the sides of my yard near the woods captures the most wasps, which makes sense. After a few years of using them, I now know where they should be located, but to get started you can experiment by spacing the traps near the most likely areas, and then seeing which traps capture the most wasps, and which capture few, or even none. Move the traps away from areas that are not productive to those that are, of course it may take a season to completely figure it out, but even with non optimal locations, you will likely capture and kill many queens.

    You need to periodically examine the traps to check for dead wasps, as well as refill with more juice as needed. Obviously you want to carefully examine the trap before opening it, to make sure all the wasps are dead, or in poor enough shape that you can kill them after dumping out the contents. Queens are fairly easy to identify, they are much larger than the usual yellow jackets you see.

    There are plans online for building your own trap from a 2 liter soda bottle. I’ve tried this, and have not had much success, but you might want to give it a try and see how it works for you.

    Again, it is imperative to get your traps out now, so you can capture and kill every queen yellow jacket possible. Each queen you kill means one fewer nest, which means thousands fewer yellow jackets invading your barbecues this summer.