Receiving DGPS Stations with MultiMode For Mac OS X

MultiMode for Mac OS X can decode DGPS (Differential Global Positioning System) transmissions. DGPS stations transmit the difference between positions indicated by GPS satellite systems and the known fixed position of the station. This allows higher accuracy. DGPS transmissions are 100 or 200 baud and are transmitted on frequencies from 285 kHz to 325 kHz. They can be interesting DX targets.

A copy of MultiMode can be downloaded here: http://www.blackcatsystems.com/download/multimode.html

To decode the transmission, tune your radio to a DGPS frequency. You can either tune directly to the frequency in CW mode, in which case you set the center frequency in MultiMode to that for your radio’s CW mode, or use USB mode, tune 1 kHz low, and set the center frequency to 1000 Hz.

You can listen to an example DGPS audio recording

Select the baud rate, either 100 or 200 baud, using the button. Also be sure to set your location so that the correct distance and bearing is calculated. Eventually, if you have tuned into a DGPS transmission that is strong enough, you will start seeing decode messages printed:

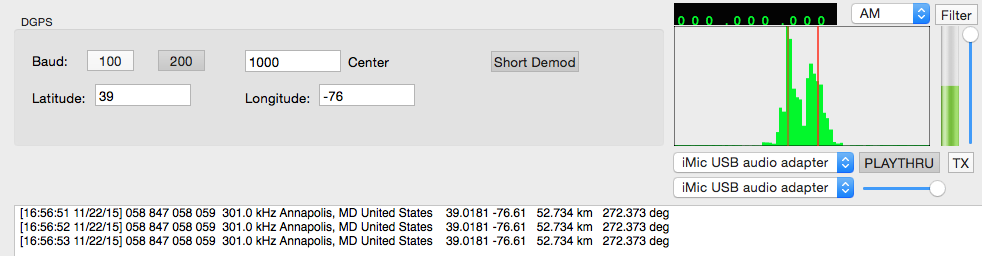
The Short Demod button can be toggled on, in which case MultiMode will look at a smaller part of the DGPS packet. This often allows decodes of weaker transmissions.

Note that since no error checking is performed on the packet, it is possible to get false decodes. To help determine if you are actually receiving the correct station, compare the printed frequency for that station to what your radio is tuned to, to verify they match. Also look for several decodes from the same station in a row, that indicates that you probably are really receiving that station.

Here’s a list of some stations I have received here with a modest 200 ft random wire antenna:

[15:44:47 11/19/15] 008 804 008 009 286.0 kHz Sandy Hook, NJ United States 40.4747 -74.0197 235.632 km 45.2895 deg
[19:27:49 11/19/15] 198 772 198 199 306.0 kHz Acushnet, MA United States 41.7492 -70.8886 529.571 km 53.1416 deg
[19:28:52 11/19/15] 190 782 190 191 305.0 kHz Dandridge, TN United States 36.0225 -83.3067 723.745 km 245.071 deg
[19:29:12 11/19/15] 156 863 156 157 311.0 kHz Rock Island IL United States 42.0203 -90.2311 1245.06 km 290.156 deg
[19:32:00 11/19/15] 012 806 012 013 289.0 kHz Driver, VA United States 36.9633 -76.5622 231.719 km 192.449 deg
[19:33:00 11/19/15] 184 788 184 185 291.0 kHz Hawk Run, PA United States 40.8889 -78.1889 280.839 km 319.079 deg
[19:33:24 11/19/15] 006 803 006 007 293.0 kHz Moriches, NY United States 40.7944 -72.7564 340.978 km 53.1725 deg
[19:33:37 11/19/15] 196 771 196 197 294.0 kHz New Bern, NC United States 35.1806 -77.0586 434.825 km 192.789 deg
[19:33:50 11/19/15] 092 843 092 093 295.0 kHz St Mary's, WV United States 39.4381 -81.1758 448.281 km 277.867 deg
[19:33:54 11/19/15] 136 792 136 137 297.0 kHz Bobo, MS United States 34.1253 -90.6964 1414.92 km 252.075 deg
[19:33:59 11/19/15] 058 847 058 059 301.0 kHz Annapolis, MD United States 39.0181 -76.61 52.734 km 272.373 deg
[19:36:40 11/19/15] 046 824 046 047 303.0 kHz Greensboro, NC United States 36.0694 -79.7381 463.251 km 226.48 deg
[19:40:01 11/19/15] 218 777 218 219 304.0 kHz Mequon, WI United States 43.2025 -88.0664 1110.64 km 298.697 deg
[19:41:11 11/19/15] 130 834 130 131 307.0 kHz Hagerstown, MD United States 39.5553 -77.7219 160.52 km 293.159 deg
[19:43:59 11/19/15] 312 929 312 313 296.0 kHz St Jean Richelieu, QC Canada 45.3244 -73.3172 736.38 km 16.5642 deg
[19:44:05 11/19/15] 154 862 154 155 322.0 kHz St Louis, MO United States 38.6189 -89.7644 1190.3 km 272.301 deg
[19:55:36 11/19/15] 112 836 112 113 292.0 kHz Cheboygan, MI United States 45.6556 -84.475 1013.8 km 319.521 deg
[20:32:19 11/19/15] 017 808 016 017 314.0 kHz Card Sound, FL United States 25.4417 -80.4525 1560.45 km 196.764 deg
[20:34:44 11/19/15] 340 942 340 341 288.0 kHz Cape Ray, NL Canada 47.6356 -59.2408 1650.3 km 49.1252 deg
[22:10:54 11/19/15] 168 869 168 169 290.0 kHz Louisville, KY United States 38.0175 -85.31 816.337 km 265.238 deg
[22:11:34 11/19/15] 192 778 192 193 292.0 kHz Kensington, SC United States 33.4906 -79.3494 681.801 km 207.126 deg
[22:20:26 11/19/15] 320 925 320 321 313.0 kHz Moise, QC Canada 50.2025 -66.1194 1464.05 km 28.7438 deg
[11:34:56 11/20/15] 262 881 262 263 302.0 kHz Point Loma, CA United States 32.6769 -117.25 3697.45 km 272.2 deg

DX Toolbox 4.3.0 Released

Version 4.3.0 of DX Toolbox, the radio propagation app for Windows and Mac OS X has been released.

This version adds the Ionosonde Plot Window. This window lets you see graphs of ionosonde data from a number of sites around the world. Select the site from the first popup menu (there are dozens of sites around the world), then select the type of graph from the second. There are three types:

foF2: This is a plot of the highest frequency that will be reflected from the F2 layer of ionosphere when transmitted straight up. As the incident angle is decreased, higher frequencies will be reflected, that is, more distant stations can be heard, or alternatively, more distant locations can receive the signal. This effect explains the “skip zone” around a transmitter site.

foEs: This is a plot of the highest frequency that will be reflected from the E layer of the ionosphere.

hmF2: This is a plot of the height of the F2 layer of the ionosphere. Along with the foF2 value, it can be used to calculate the MUF for a given path.

Here is a screenshot of what the window looks like, click on it to see it full sized:

DX Toolbox also displays a variety of other information, here is the main window of current space weather:

There is also this chart of recent solar and geomagnetic conditions:

Several propagation forecasting tools are also available. This one computes the MUF (maximum usable frequency) and LUF (lowest usable frequency) between two locations, as well as the estimated received signal levels:

You can read more about DX Toolbox here, and see more screenshots here.

Copies of DX Toolbox for both Windows and Mac OS X can be downloaded from the download page.

An version (minus a few features) is also available for the iPhone and iPad.

Receiving HF Weather Fax Transmissions On Your iPad, iPhone, iPod Touch or Android Device

It’s markably easy to receive weather fax transmissions without a computer today, you just need an app for your smartphone or tablet, along with an appropriate shortwave radio. This can be extremely handy for mariners who do not have internet access at sea, but want to be able to receive weather charts to keep abreast of storms and other potentially dangerous conditions. It’s also a way for radio hobbyists to decode and view weather fax transmissions without using a computer.

For the iPhone, iPad, and iPod touch, there’s the HF Weather Fax app from Black Cat Systems, available on the iTunes store: https://itunes.apple.com/app/hf-weather-fax/id394199597?mt=8

An Android version is also available on the Google Play store: https://play.google.com/store/apps/details?id=com.blackcatsystems.weatherfax

Under good reception conditions, very high quality weather fax images can be received (click the image to see a full sized version):

A radio capable of receiving the transmissions is also required. Most SSB marine radios should be able to do this, in addition there are many relatively low cost consumer radios that will also work, such as the Sony ICF-SW7600GR .

Next, you need to get the audio from the radio into the tablet or smartphone. While there are some patch cables that will work, weather fax is fortunately a rather forgiving mode to receive, and often just placing the device’s microphone next to the radio’s speaker (or better yet next to some headphones plugged into the radio) often works quite well.

Weather faxes are sent several times a day from dozens of locations around the world. NOAA has their online Worldwide Marine Radiofacsimile Broadcast Schedules listing them by region and country, and is an essential resource. The frequencies listed are carrier frequencies, to tune them in USB mode on your radio, subtract 1.9 kHz. For example, NMF from Boston MA transmits on a carrier frequency of 6340.5 kHz. Your radio should be set to USB mode, and tuned to 6338.6 kHz for proper reception.

Both of these apps will automatically detect the start of fax tone sent at the beginning of an image transmission, to properly align the image. They will also detect the end of fax tone, and use that to save the image, for later viewing. Note that relatively good reception is required for proper detection of the start and stop tones, a weak signal or lots of static or interference (or even audio pickup from the microphone) can cause the tones to be missed.

Here’s a short video made by a user of HF Weather Fax on the iPad:

And here’s a video showing the Android app:

Building the STM32F4 DISCOVERY Toolchain For Mac OS X

The STM32F4 DISCOVERY is a very neat development board for the STM32 F4 series microcontroller. Not only is it neat, but also cheap. As in $14.55. Here’s the link to buy one from Mouser.

I have some radio related projects that I plan on implementing with this unit. But first I had to get the Open Source development tools installed. And while there are numerous webpages that describe how to do this, none of them actually worked. Such is the world of Open Sores.

With a bit of help, I was able to get things up and running. To save others grief, I’m documenting what I did to get things working. First, a brief description of what goodies you get with this development board.

Here’s a datasheet for the development board.

Some of the Features:
■ STM32F407VGT6 microcontroller featuring 32-bit ARM Cortex-M4F core, 1 MB Flash, 192 KB RAM in an LQFP100 package
■ On-board ST-LINK/V2 with selection mode switch to use the kit as a standalone ST- LINK/V2 (with SWD connector for programming and debugging)
■ Board power supply: through USB bus or from an external 5 V supply voltage
■ External application power supply: 3 V and 5 V
■ LIS302DL, ST MEMS motion sensor, 3-axis digital output accelerometer
■ MP45DT02, ST MEMS audio sensor, omni-directional digital microphone
■ CS43L22, audio DAC with integrated class D speaker driver
■ Eight LEDs:
– LD1 (red/green) for USB communication
– LD2 (red) for 3.3 V power on
– Four user LEDs, LD3 (orange), LD4 (green), LD5 (red) and LD6 (blue)
– 2 USB OTG LEDs LD7 (green) VBus and LD8 (red) over-current
■ Two push buttons (user and reset)
■ USB OTG FS with micro-AB connector
■ Extension header for all LQFP100 I/Os for quick connection to prototyping board and easy probing

Now for the gory details of actually getting all this to work:

First, my system:

I installed this on a Mac Book Pro running Mac OS X 10.6.8. I wanted it on a laptop so I could take it to my basement workshop to do the actual development work. You can do this under linux and Windows as well. I don’t have any information on doing that, you’re on your own. Good luck.

I installed Xcode 4.2, which is the latest version that will run on 10.6 Snow Leopard. I understand that Xcode 4 is required to get the development stuff up and running, I do not know that for a fact, however.

First you need to install a bunch of stuff:
brew install mpfr gmp libmpc texinfo libusb-compat libftdi wget

This uses Homebrew, which you must install if you don’t already have it.

This toolchain script was used as the base: https://github.com/ehntoo/summon-arm-toolchain

As I said earlier, it does not quite work out of the box.

A big thanks to Gwynne who came up with a patch.

So all you need to do is:

cd && git clone git://github.com/ehntoo/summon-arm-toolchain.git && cd summon-arm-toolchain && wget -O - http://darkrainfall.org/build-openocd.patch | patch -p1 && ./summon-arm-toolchain

Then… wait. A while. It takes 20-30 minutes to build everything. Go have lunch.

All of the dev tools are put into ~/sat so make sure that is in your $PATH variable:
export PATH="$HOME/sat:$PATH"

Plug in the dev board and connect to it with the On Chip Debugger:
openocd -f board/stm32f4discovery.cfg

if all goes well, a bunch of text is spit out into the terminal window, ending with:
Info : stm32f4x.cpu: hardware has 6 breakpoints, 4 watchpoints

Then open up another terminal window and connect to the On Chip Debugger:
telnet localhost 4444

Next I grabbed the STM32 Discovery firmware files, to get some sample code:
git clone https://github.com/nabilt/STM32F4-Discovery-Firmware.git

I decided to try the IO_Toggle project first, which turns some digital outputs, connected to LEDs on the board, on and off. Toggling LEDs is the microcontroller version of a Hello World program.

Building the project did not go completely smoothly. I needed to change a line in the Makefile dealing with floating point:
MCFLAGS = -mcpu=$(MCU) -mthumb -mlittle-endian -mfpu=fpv4-sp-d16 -mfloat-abi=hard -mthumb-interwork
to
MCFLAGS = -mcpu=$(MCU) -mthumb -mlittle-endian -mfpu=fpv4-sp-d16 -mfloat-abi=softfp -mthumb-interwork

I don’t yet have a good explanation as to the need to make the change, but I saw it mentioned on many websites while searching for a solution to the problem.

The result is a demo.elf file which gets downloaded to the dev board.

Open up yet another terminal window (while in the directory containing demo.elf) and run gdb via:
arm-none-eabi-gdb

In the OCD telnet window, stop the program currently running on the microcontroller:
reset halt

Then in the window running gdb:
target extended localhost:3333
load demo.elf

Then in the OCD telnet window run the program:
reset run

I was rewarded with blinking LEDs. I then edited the main.c source code to change their toggle rate, and re-built the project, as a test, which all worked.

Next step, some radio related programming!

mySdrPlayback – Mac OS X App to Play Back SDR I/Q Recording Files

I use an RFSpace netSDR to record the 43 meter (6800-7000 kHz) pirate radio band, overnight and often in the daytime as well. I then go back and check the recordings, to see what stations have been on the air. This lets me catch lots of broadcasts even when I am away from the shack.

Going through the recordings with traditional SDR software can be extremely tedious. You literally have to play the recordings at a real time rate, hoping to stumble across a transmission. Even being able to skip ahead and back is not much better.

So I ended up writing my own app to make the process of analyzing SDR recordings for interesting transmissions much easier and faster. I’ve just recently made this app available for others to download and use. It’s called mySdrPlayback (although it could probably use a more catchy name).

This is what the program window looks like (click on it for an enlarged image):

When the app loads, it reads in a list of all the recording files from the directory you have told it they are stored in. Clicking on a file loads it. A waterfall of the entire file is created, that is what you see in the large area on the right side of the window. The x axis is frequency, the y axis is time. Any transmissions are immediately obvious, such as a pirate on 6925 in AM mode, as well as WWCR, also in AM mode, on 6875 kHz. SSB and the various digital modes also have distinctive visual appearances. In no time, you can tell what type of transmission it is just by looking at it.

Files created by SpectraVue, the SDR app that RF Space supplies with their radios, SdrDx, the third party app also for RF Space radios, as well as files created by Perseus can be read. Other file types could probably also be added, if their exact format is known.

Selecting a portion of the recording file to play back could not be easier. Just drag select with the mouse by drawing a rectangle around it. Select the mode, and click Play. The frequency and time limits are displayed in the Secs Start/End and Demod fields when you drag select, you can also edit them in the boxes by hand if needed, to fine tune things.

The buttons to the left and right of Play let you skip playback behind or ahead by 10, 30, or 60 second increments, or even by 5 minutes. This makes it easy to jump around, looking for an ID. An S meter updates during playback, showing the signal strength in dBm.

The Demod To File button will demodulated the entire selected transmission to a WAVE file. You can then feed that into a decoding program, such as MultiMode if you want to decode an SSTV or other digital mode. You can also convert it to an mp3 file using your own utility, if you want to post it for others to download.

mySdrPlayback is only available for Mac OS X. There is no windows or linux version, and there never will be one. It’s written in objective-c and uses the extremely powerful and feature rich cocoa API. That makes development extremely easy, but is only available for the Mac. It can be downloaded from the program page: http://www.blackcatsystems.com/software/sdr_iq_recording_playback_program.html

Lies, Damned Lies, and Receiver Images

I have my SDR-14 receiver online, for some listeners to use. The other day, there was a logging of Trenton military aviation weather on 6950 kHz. I had not seen other reports of Trenton aviation weather on this frequency. And, since 6950 is a very popular frequency for pirate radio in the USA, this could cause some concern, as QRMing military stations is generally bad karma for pirates.

Here is a recording of Trenton Aviation as received on the SDR-14.

As it turns out, I had been running a recording of 6800-7000 kHz via another SDR, my netSDR. So I went back, and checked that recording at the same time the SDR-14 had picked up Trenton on 6950. Nothing. Nothing at all. And the netSDR is connected to a much better antenna than the SDR-14. Hmm. This is strange.

Last night, I was alerted that Trenton was again being heard on the SDR-14 on 6950 kHz. So I went and tuned in on the netSDR, and again heard nothing. I then decided to look for a schedule of frequencies used by Trenton, and found that they should be on 6754 kHz. I tuned in, and sure enough, there they were. Coming in very well, about S9+30 dB or so. Hmm… I did a quick calculation, and the difference between 6950 kHz and 6754 kHz is 196 kHz. 196 kHz, that sounds familiar. Why yes, that’s the I/Q sample rate of the SDR-14!

Now it all makes sense – the received signal on 6950 kHz is an image, a false signal generated by the receiver. It turns out that even SDRs are not immune to images. (Shhh… don’t anyone tell Al Fansome)

Images have been the bane of DXers for decades. They often manifest themselves as a particularly strong signal that is picked up on other frequencies. With an analog receiver, these frequencies are often offset from the actual frequency by the IF frequency of the receiver. With VHF/UHF radios and scanners, this is often 10.7 MHz, or close to that. In the case of the SDR-14, the image was located at an offset equal to the I/Q data rate. It was probably being heard on 6558 kHz (6754 kHz – 196 kHz) as well.

If you’re hearing an unexpected signal, one suggestion is to try another radio, ideally one with a different IF frequency. If you don’t hear the signal on the second radio, then it is most likely an image. Or your other radio is broken. But it’s probably an image. Ask another DXer if they can hear it, as well.

There’s a ham in Erie, PA that has been harassing the local club that runs a 2 meter repeater with claims of interference to the VHF marine band. The FCC has investigated, and found no interference. Multiple hams have contacted the Coast Guard and they have not had any interference issues. The only person who reports interference is the previously mentioned ham, who lives a few hundred yards from the building housing the repeater. I’ll close by noting that the VHF marine band is about 10.7 MHz above the 2 meter band frequency used by the repeater – 146.610 MHz.

New version of SdrDx available, now for Windows also

There’s a new version of SdrDx, the free app for RF Space SDRs (SDR-IQ, SDR-14, netSDR, etc): http://fyngyrz.com/?p=915

This version includes a lot of new features, including recording I/Q data directly to disk, so you can then play it back. Think of it as a VCR. You can, for example, record the entire 43 meter band (6800-7000 kHz or so, depending on your SDR model) and then go back later and run the I/Q recording back through SdrDx again. It’s awesome! Previously I’ve had to run SpectraVue under vmware to do this, now I can do it natively on the Mac.

I use a program I’ve written myself, that reads in the I/Q data file, and plots a waterfall for the entire file. I can then selectively demodulate what signals I want. I can record all of 43 meters overnight, then check in the morning to see who was on, and listen in. I don’t miss anything, nor do I have to choose if there’s two, or even three pirates on at the same time. I can listen to all of them. At some point I may release this for others to use (Mac OS X only) but it’s still pretty crude right now.

There’s lots of other new features and improvements to SdrDx, so if you have an RF Space SDR, go download a copy to try out.