Ferrite Core 1, RFI 0

Once again, a giant ferrite toroid coil saves the day. I have a random wire antenna (about 100 foot long) running into the basement workshop, fed with RG-6 coax (the coax shield is left floating at the antenna end). Reception was horrible, I could barely hear anything, even SWBC stations. I considered that maybe it wasn’t a lack of signal problem so much a signal to noise problem, so I located a large ferrite toroid coil from the junkbox, wrapped as many turns of coax around it as I could (about a dozen), and placed that in series with the incoming coax, just before the radio. Voila, the noise/hash was gone. The choke helps to reduce RFI flowing as currents on the shield of the coax.

The ferrite core was a Fair-Rite 5943003801, 61 mm toroid, type 43 ferrite. I buy mine from Mouser for about $4 each: http://www.mouser.com/ProductDetail/Fair-Rite/5943003801

Here’s a photo showing how the coax is wrapped around the toroid core:

And here are some before and after video recordings. The gap about half way through each is when I disconnected the incoming coax to the radio, and inserted the choke, and then reconnected the coax:

More adventures in filtering the power supply for an AFE-822 SDR

I frequency monitor and record the 285-325 kHz DGPS band, looking for DX beacons. Recently, I noticed a noise source centered around 315 kHz, almost 10 kHz wide, on my AFE 822 SDR with a 500 ft beverage antenna:

I tried hunting around the house with a portable radio, looking for it, but could never find it. I then checked on my netSDR, with a 670 ft sky loop antenna, and it was not visible there. Very curious. I then tried the beverage antenna, and could still not observe it. But it was there with the AFE822, with either antenna. This made me suspect noise was entering the AFE-822 through the power supply. I was use the USB input for power, and previously wrote about my attempts to reduce the noise from the power supply. This noise source was new since then, possible due to something else added to the shack.

I decided to put together a filtered DC power supply, using linear wall transformer, and adding filtering via capacitors and an inductor.

The circuit itself is fairly simple:

The output of the transformer I used is about 10 volts under load. I chose a 5 ohm power resistor to place in series, which dropped 2.5 volts, so the resulting DC power supplied to the AFE 822 is 7.5 volts. The value of this resistor depends on the output voltage from the DC supply. The AFE-822 draws 0.5 amps, Ohms Law can be used to calculate the desired resistance. The AFE822 has a voltage regulator inside it (it appears to be an LM7805 variant, possibly low drop out), so it can tolerate a wide range, the AFE 822 website specifies 7 to 10 volts.

The inductor is from the junk box, I don’t know what the value is. While I’m telling myself it helps to filter, I might try to find a known, larger value. The 1000 uF electrolytic capacitors provide low frequency filtering, the 0.047 uF ceramic caps provide RF filtering.

The filter circuit was constructed dead bug style on the lid of a small metal can:

Here it is mounted on the can:

And now the spectrum, with the new power supply. Certainly an improvement:

Yet Another !&*%$! Noise Source

The past few days, I have noticed higher than usual noise levels, generally on the lower frequencies, and particularly on the longwave band, including the 285-325 kHz DGPS band, where I run nightly SDR recordings, to later process the data and decode and detect DX DGPS stations using my Amalgamated DGPS app.

Thinking back to what new electronics devices have been added to the house, two came to mind, a new cable modem, and a new ethernet switch. The switch is up here in the shack, so it seemed to be a likely candidate. The switch is a D-Link DES-1008E 8-Port 10/100 Unmanaged Desktop Switch. It uses a mini USB port for power, using either the included AC adapter, or power from a USB port. When I installed it, I decided to not use the AC adapter, but rather a USB port on my UPS, figuring it was better to not add yet another potentially noisy switching power supply to the mix.

The test was easy, I just unplugged the power to the switch. Sure enough, the noise vanished. Great, the switch is a RFI generator. Or is it? As another test, I plugged it into a port on a USB hub. No noise. Hmm… so it seems that the noise is indeed from the USB port on the UPS. I did not notice any increase in the noise floor when I got the UPS a few months ago, but It’s something I should look into again, just to be sure. The UPS is a CyberPower CP1350PFCLCD.

Here’s a waterfall from the SDR, showing the DGPS band, 280-330 kHz. You can see where I changed the power to the switch from the UPS USB port to the USB hub, the bottom part of the waterfall is when the switch was still powered by the UPS (click to enlarge it):

I still have a noise source just above 305 kHz to hunt down.

Update

I decided to see what I could do to improve things, and reduce the noise floor.

Here is the baseline, after no longer powering the switch from the UPS:

First, I relocated the AFE822 away from the computer and rats nest of assorted cables behind it, powered from an HTC USB charger:

The squiggly noise around 305 kHz vanished!

I then switched to an Apple USB charger / power supply, as their products tend to be a bit better made:

Another improvement, the overall noise floor is a bit less now.

But can we do better? I then switched to an older USB hub for power to the AFE822, that I thought might be better filtered:

I then changed to a linear supply plugged directly into the AFE822. I don’t notice any obvious improvement? Maybe it even looks like a little more noise? Difficult to tell. You can see a DGPS station popped up on 304 kHz while I was switching things around, between the last two tests, it was likely Mequon, WI.

Reducing Local QRM With A Few Ferrite Cores

One downside to an SDR is that you more easily notice the mysterious carriers and other local noise/RFI signals. After reading this article on Common Mode Chokes, I decided to see what I could do to improve my situation.

As a first step, I captured this baseline of the 6500-7000 kHz range, where I am most interested in listening (click to enlarge):

I then added a choke on the antenna input to the SDR, right where it enters the radio. It is 9 turns of the coax on a large toroid core, probably type 37 or 43 material, possibly a Fair-rite 5943003801:

The other coax cable next to the antenna input is the reference signal from the 10 MHz GPS reference. Adding ferrite to it had no effect. I’ll get to the orange toroid next. Here is the result (click to enlarge):

As you can see, there was a significant reduction in the number of carriers and other noise signals.

Next I added the orange toroid also pictured (unfortunately I have no idea what type of ferrite it was, it was from the junkbox), as well as two of the clamp on ferrites you often see on AC power or video cables to the ethernet cable that runs from the SDR to the computer, here are the results: (click to enlarge):

This got rid of a few more. Pretty much, what is left is an actual signal. I was able to identify these:
6604 New York Radio
6519 A voice transmission, perhaps another VOLMET
6660 The second harmonic of CHU 3330
6725 An RTTY transmission
6885 Israel fading in
6970 faded in and out, so it seemed to be a legit DX station

Here’s a slightly later shot of 43 meters (6800-7000kHz):

All in all, a significant improvement, for a few minutes worth of work!

Measuring The Velocity Factor of Coax Using an SDR

Recently I had the need to measure the velocity factor of some coax. The velocity factor of a transmission line is ratio of the actual propagation of radio signals through the cable vs the speed of light in a vacuum.

Here’s the coax in question:

It’s RG-6U, for which I have seen published velocity factors ranging from 0.65 to 0.85, depending on the manufacturer and type of dielectric. This coax was laying in my junk box, and I have no idea who makes it, or what the claimed specifications are. The performance of a lot of lower cost coax often widely varies from published specs, as well.

One technique to measure the velocity factor of a transmission line is to use a piece of it as an open stub, which is a section of transmission line connected to another line via a Tee connector. The added transmission line is open at the other end, hence the term “open” stub. The open stub will act as a notch filter for frequencies with a wavelength close to four times the length, in other words the stub is 1/4 wavelength.

For this measurement, I used an SDR (Software Defined Radio) as the measurement device. In this case an SDR-14. To generate RF I used a noise bridge.

The output of the noise bridge is a good source of wide-band RF.

Here is the Tee. On the left is the RF signal, on the bottom is the connection to the SDR, on the right is the open stub.

With the noise bridge connected, but no stub, here is what the SDR spectrum looks like, click to enlarge:

As you can see it is relatively flat. Next, we’ll connect the 1/4 stub (again, click to enlarge):

You can see the dip in the signal level, caused by the stub.

In this case, the stub was 13 ft (4 meters) of cable. Iif the velocity factor was 1.00 the wavelength would be 16 meters, the frequency 18.75 MHz. The frequency of the center of the notch is 15.7 MHz, so the measured velocity factor is 15.7 / 18.75 = 0.84.

Next I used a 9 ft 3 inch (2.85 meter) cable. The wavelength for a velocity factor of 1.00 would be 11.38 meters, the frequency 26.35 MHz. The frequency of the center of the notch was 21.8 MHz, so the measured velocity factor is 0.83.

Using both cables, the total length is 6.85 meters, the wavelength for a velocity factor of 1.00 would be 27.4 meters, the frequency 10.95 MHz. The frequency of the center of the notch was 9.1 MHz, so the measured velocity factor is 0.83.

For this piece of coax, the velocity factor seems to be 0.83, which is a reasonable value.

Spying on your neighbor’s grill thermometer – Monitoring the 433.92 MHz ISM Band with an RTL Dongle

Remote weather stations, some car key fobs (although many in the US use 315 MHz), wireless grill thermometers, and many other devices use the 433.92 MHz ISM (Industrial, Scientific and Medical) band. Chances are good that if it is a wireless sensor, it uses this band.

Here is a waterfall showing transmissions observed here, using one of the inexpensive USB RTL DVB-TV Dongles:

The entire waterfall occupies 139 seconds.

You can observe several periodic transmissions. I have a remote weather station and a remote thermometer, so that accounts for two of them.

If you have an RTL tuner dongle, take a look and see what 433 MHz transmissions are occurring near you.

Solar Storms (plus Solar Hurricanes, Typhoons, and other ways the Sun will vaporize us or even worse, possibly cause your iPhone to not work)


Over the past few years, there has been dramatically increased media coverage of solar flares, and the effects they can have on the Earth, primarily on our electrical distribution and communications systems. The emphasis has been on the ability of the flares to cause geomagnetic storms on the Earth, which then can induce currents in our electrical power grids, causing them to go offline from damage. There has been a tremendous amount of fear instilled in the public by the hundreds, if not thousands, of news articles that appear every time there is a solar flare.

Those of us who are shortwave listeners or amateur (ham) radio operators are typically familiar with solar flares, and some of the effects they can cause. To summarize:

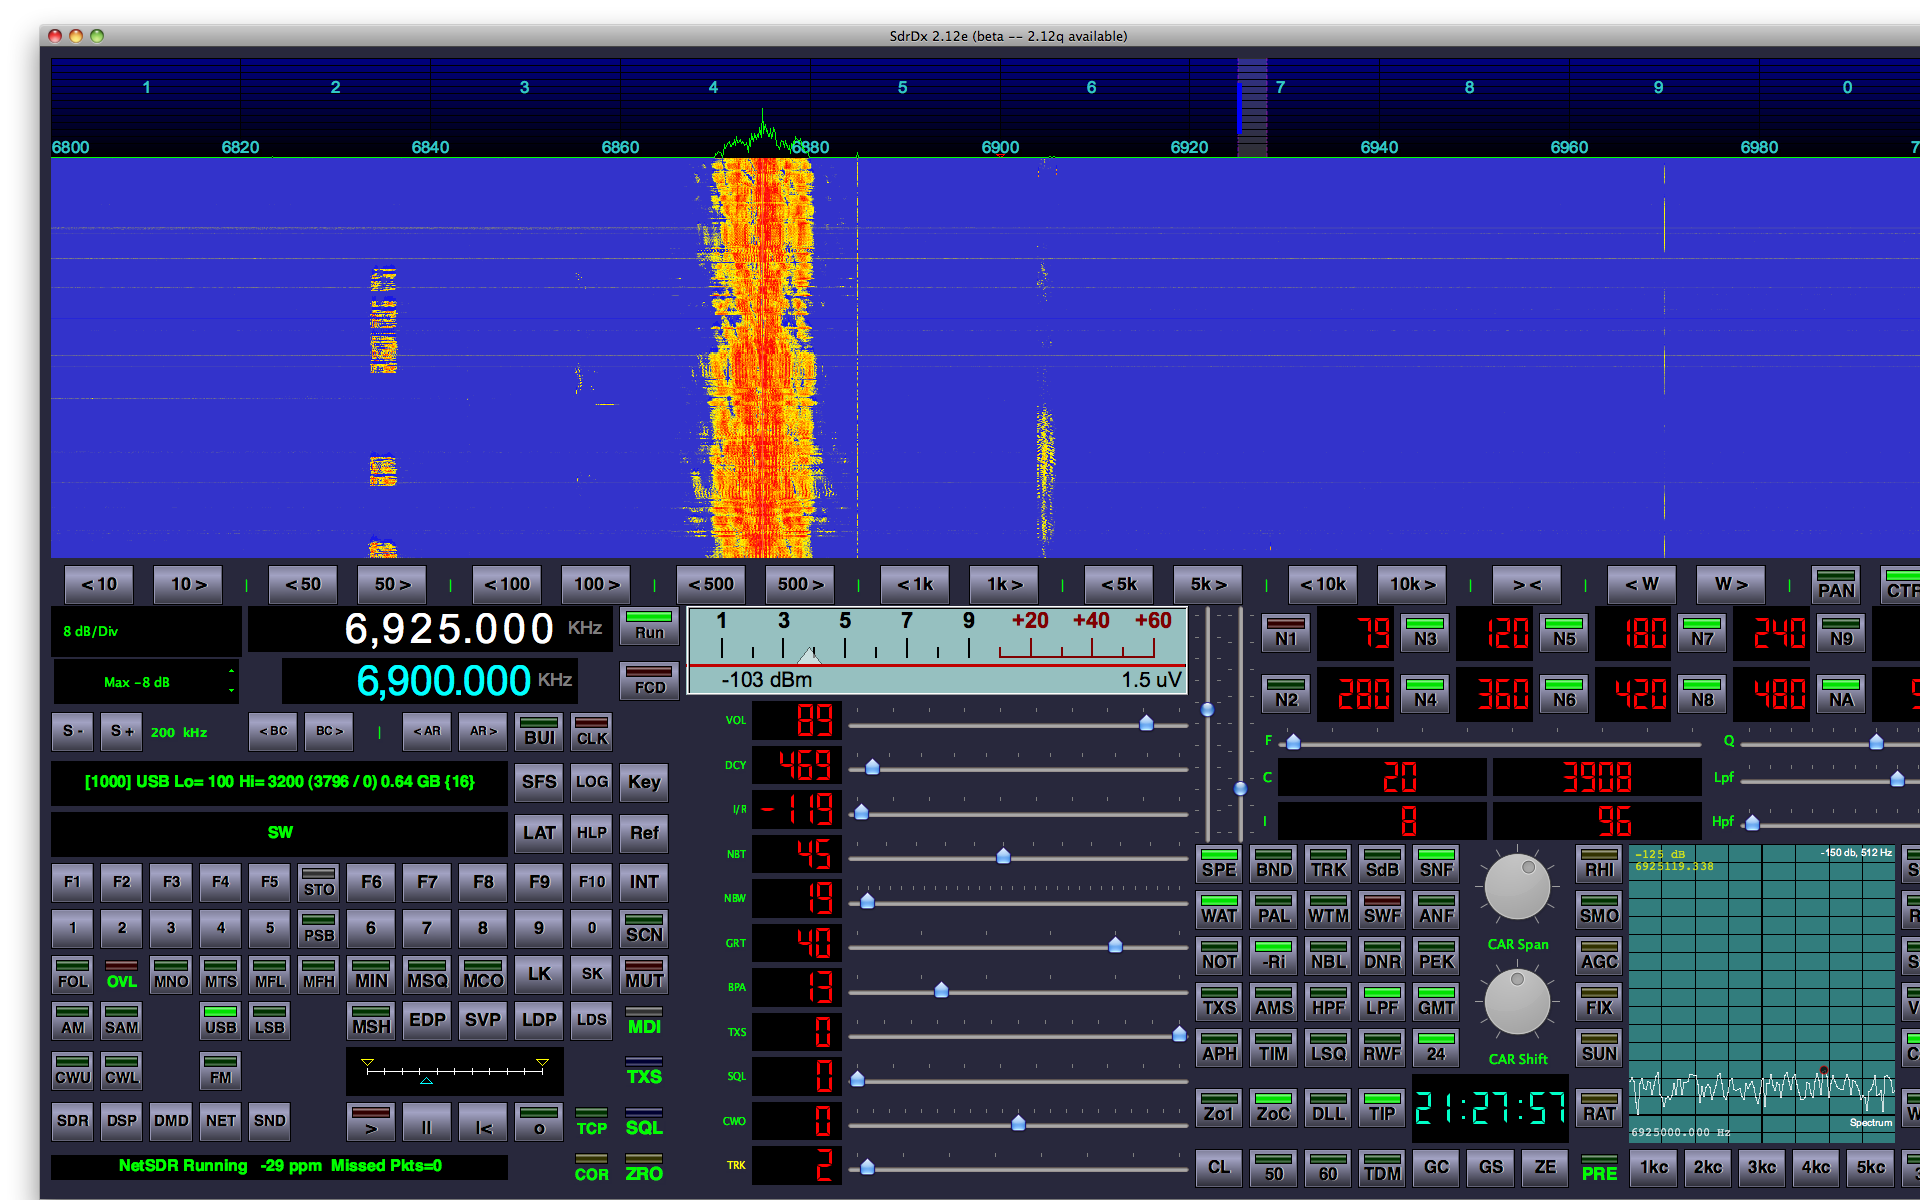
A solar flare is a sudden brightening of a portion of the Sun’s surface. A solar flare releases a large amount of energy in the form of ultraviolet light, x-rays and various charged particles, which blast away from the solar surface. The x-rays can have an almost immediate effect on the Earth’s ionosphere, the layer of charged particles above the atmosphere, which allows for distant reception of shortwave radio signals. I discuss the effects of x-rays on the ionosphere this earlier article. Energetic solar flares can cause what are known as radio blackouts, where all of the shortwave spectrum appears to be dead, with few or no stations audible. Other communications bands, such as AM / medium wave (MW between 526-1705 kHz), FM, TV, and cellular phones are not affected. Just shortwave. Also, the portion of the Sun producing the flare must be roughly facing the Earth to have an effect, and only the sunlit portion of the Earth is affected.

The solar flare can also cause a Coronal Mass Ejection (CME), which is a burst of energy, plasma, particles, and magnetic fields. The CME typically takes one to three days to reach the Earth. When it does, it can cause a geomagnetic storm, which is a disruption of the Earth’s magnetosphere. The magnetosphere is a region of space surrounding the Earth, where the magnetic field of the earth interacts with charged particles from the sun and interplanetary space.

The CME can produce very high radiation levels, but only in outer space. If you’re an astronaut on the International Space Station, this could be a concern. If not, you don’t really have much to worry about. High altitude airline flights can result in somewhat higher than usual radiation doses, but high airline flights always result in higher than usual radiation doses, due to less atmosphere protecting you from cosmic radiation. You might just get a little more especially if you fly over the North Pole. Or over the South Pole, but I don’t think there are too many of us who do that.

The effects of a geomagnetic storm:

The Earth’s magnetic fields are disturbed. This can cause compass needles to deviate from their correct direction towards the poles, and has been frequently mentioned in medieval texts.

Communications systems can be impacted. As with solar flares, shortwave radio is most affected. AM can also be affected to some degree. FM TV, and cell phones are not affected.

Back in 1859, there was a large geomagnetic storm, often called the Carrington Event because the solar flare that caused it was seen by British astronomer Richard Carrington. The effects were dramatic. Aurora were seen as far south as the Caribbean. Telegraph lines failed, and some threw sparks that shocked operators. Storms of this magnitude are estimated to occur about every 500 years. Other very large geomagnetic storms occurred in 1921 and 1960, although neither was the magnitude of the 1859 storm. The term “Carrington Event” has now come to mean an extremely large geomagnetic storm that could cause devastating damage to the communications and electrical systems around the world. But these forecasts are often based on the notion that, with more communications and electrical systems in place, we are much more reliant on these systems and vulnerable to disruption, meanwhile ignoring the fact that we better understand how geomagnetic storms cause damage, and what can be done to prevent it. Remember, this was 1859, and very little was even known about how electricity worked, let alone the effects of geomagnetic storms. This was in fact the first time that the relationship between solar flares and geomagnetic storms was established.

Communications satellites can be affected due to the higher radiation levels and unequal currents induced in various parts of the satellites. This could cause the satellites to temporarily malfunction, or even be damaged (which could affect FM, TV, and cell phone calls, which would otherwise be unaffected). As satellites are always in a high radiation environment, they are protected, and it would take very severe conditions to cause extensive damage.

Between 19 October and 5 November 2003 there were 17 solar flares, including the most intense flare ever measured on the GOES x-ray sensor, a huge X28 flare that occurred on November 4. These flares produced what is referred to as the Halloween Storm, causing the loss of one satellite, the Japanese ADEOS-2. Bear in mind that there are almost a thousand active satellites in orbit.

GPS navigation can also be affected, due to variations in the density of different layers of the ionosphere. This can cause navigation errors.

But the effect that, thanks to media hype, everyone is most concerned about is the possibility of a solar flare causing a geomagnetic storm that destroys the entire power grid, leaving virtually the entire United States without power for weeks or even months. The good news is that this is highly unlikely to happen.

Here’s the scenario: The geomagnetic storm causes currents to be induced in the wires that make up the long distance transmission lines that connect the various electrical power plants and users across the United States, aka the power grid. If these currents become large, they can damage equipment such as transformers, leading to widespread power outages.

And indeed this happened, on a much smaller scale, on March 13, 1989. A geomagnetic storm caused ground induced currents that severely damaged seven static compensators (devices that are used to regulate the grid voltage) on the La Grande network in the Hydro-Quebec, Canada power grid, causing them to trip or shut down automatically. The loss of the compensators allowed fluctuations in the grid voltage, causing damaging to other devices. The net result was that over 6 million people in Quebec and the Northeastern United States were without power for about 9 hours. Another million were without power after the 9 hours. Parts of Sweden also had electrical power disruptions.

While being without power for 9 hours, or even several days, sounds dreadful, especially in this age of constant communications, it does happen routinely. Hurricanes and tropical storms often cause millions to lose power outage each year, as do snowstorms, ice storms, and thunderstorms. Even heat waves have caused massive blackouts. I was without power for a week after Hurricane Isabel in 2003. The concern with an extreme geomagnetic storm, such as a repeat of the Carrington Event, is that critical components such as large transformers could be damaged, which can take time to repair or replace. And there’s the fear that widespread damage to the electrical grid could result in more components being damaged than spare parts exist, causing even longer delays until they can be replaced.

In the two decades since the 1989 event, more protective devices have been installed, and electrical transmission line operators are more aware of the damage caused by induced currents from geomagnetic storms. Preventative measures, such as temporary blackouts for several hours until conditions stabilize, can prevent much of the damage from a large geomagnetic storm. The advanced warning of geomagnetic storms now possible due to the satellites that are continuously monitoring the Sun and the Earth’s geomagnetic field can give electrical transmission line operators the advanced warning they need to take preventative measures.

Also, the 1989 event occurred in Quebec, which is at a very northern latitude. Geomagnetic storms tend to be stronger near the poles, and less severe as you move towards the equator (much like how the aurora is commonly seen near the poles, but not elsewhere).

It’s also worth noting that there are actually three electrical grids in the United States: an Easter, Western, and Texas grid. They are not currently connected to each other, although there are discussions to do so.

Finally, while a repeat of the Carrington Event is possible, it is extremely unlikely (remember, they are thought to occur about once every 500 years). There are far more important things to plan for, such as blizzards, hurricanes, tornadoes, and even severe thunderstorms, which routinely do occur. It is certainly more prudent to prepare for events like these, by keeping batteries, portable radios, canned food, and jugs of water on hand, than to worry about an event that probably won’t happen again for several hundred years.

So, why all the media frenzy and public concern over solar storms?

First, the Sun operates on a roughly 11 year solar cycle. Solar activity, including the appearance of sunspots and solar flares, peaks about every 11 years, and then fades until the next solar peak. There’s a solar peak occurring right about now. The last one was in 2001. This was before Facebook, Twitter, and everyone spending several hours a day on the internet, obsessing about the crisis du jour. Or crisis of the year in this case. Back in 2001, very few people even knew there was such a thing as a solar flare, other than space scientists and ham radio operators.

Those of us who have been involved with radio related hobbies for some time are used to the 11 year cycle. As an SWL since 1978, I’ve witnessed several solar cycles. During a solar peak we get many more flares which disrupt reception, although the overall higher level of solar activity is actually beneficial to shortwave propagation. Plus, it’s more likely that we’ll get to see the aurora. Then things calm down for many years, until the next solar peak.

There’s also been a substantial increase in advocacy by scientists and other public officials for increased spending on solar flare / geomagnetic storm research and related programs. Obviously this is justified to some extent, as we are much more reliant upon technology, and even just electricity, than we were decades ago. Still, I wonder if things are being exaggerated just a wee bit. Government officials and those involved in research have a vested interest in increasing their budgets and staffs – it’s job security for them. I’m not suggesting any malice, pretty much everyone thinks their job is important, especially those in the scientific field. It’s human nature.

This increased advocacy has resulted in increased media coverage as well. I’m far less sympathetic here. The motto of many news organizations seems to be “If it bleeds, it leads”. Pretty much every time there’s a solar flare, there’s a flurry of news articles announcing impending doom. The titles are amusing, not only are there SOLAR STORMS, but also SOLAR HURRICANES, SOLAR TYPHOONS, and SOLAR TSUNAMIS. I haven’t heard of any SOLAR TORNADOES, but maybe next month. Invariably the articles describe how a solar flare can wipe out the entire power grid, sending us all back to the stone age. And this might be the one that does it! Of course, a day or two later, when the CME arrives and little happens other than poor shortwave radio listening and some enhanced Northern Lights, there’s no followup article. Although if there was, I’m sure it would state that while we dodged the bullet this time, the next flare will surely fry us all. And our iPhones.

Some examples:

Nasa scientists braced for ‘solar tsunami’ to hit earth

The Daily Telegraph disclosed in June that senior space agency scientists believed the Earth will be hit with unprecedented levels of magnetic energy from solar flares after the Sun wakes “from a deep slumber” sometime around 2013.

Cities blacked out for up to a year, $2 TRILLION of damage – with a 1 in 8 chance of solar ‘megastorm’ by 2014

Imagine large cities without power for a week, a month, or a year. The losses could be $1 to $2 trillion, and the effects could be felt for years.

‘A longer-term outage would likely include, for example, disruption of the transportation, communication, banking, and finance systems, and government services,’ the NRC report said, it was reported on Gizmodo.

‘It could also cause the breakdown of the distribution of water owing to pump failure; and the loss of perishable foods and medications because of lack of refrigeration.’

Solar Flare: What If Biggest Known Sun Storm Hit Today?

Repeat of 1859 space-weather event could paralyze modern life, experts say.

A powerful sun storm—associated with the second biggest solar flare of the current 11-year sun cycle—is now hitting Earth, so far with few consequences. But the potentially “severe geomagnetic storm,” in NASA’s words, could disrupt power grids, radio communications, and GPS as well as spark dazzling auroras.

The storm expected Thursday, though, won’t hold a candle to an 1859 space-weather event, scientists say—and it’s a good thing too.

If a similar sun storm were to occur in the current day—as it well could—modern life could come to a standstill, they add.

The news articles are bad enough, but I suspect the fact that 11 years ago no one saw articles like this, or even knew solar flares existed, has convinced a lot of the public that solar flares (of this magnitude and frequency of occurrence) are a new phenomena. It probably doesn’t help that this is the year 2012, and we’ve had the Mayan 2012 END OF THE WORLD nonsense to deal with for the last decade or so. I wonder if anyone has retconned Mayan history into them having a solar observatory and been aware of the 11 year solar cycle, and how it would peak in 2012, destroying the Earth. Maybe they even had an x-ray satellite in orbit. I bet the aliens that helped them build their pyramids left them one. The grays are helpful, like that.

Perhaps the most ironic part of this entire saga is that the 2012 solar cycle peak is forecast to be extremely low. Here’s the latest forecast and current progress through the cycle, click to enlarge it:

The peak smoothed sunspot number (SSN) is forecast to be about 60, vs the 120 for the previous cycle. The lower peak SSN means lower overall solar activity. That means fewer flares, and they should (overall) be less severe. The peak is also forecast to be in 2013, so I’m not sure how that works out for all the 2012 Doomsayers.

To put this further into context, here’s a graph showing all the previous solar cycles:

The red arrow points to the cycle peaking in 1928, the forecast at the time (2009) was that the cycle we’re in now would be similar to that one, it’s since turned out that activity is even lower.

The largest peak is Cycle 19, from the 1950s. Many older ham radio operators have fond memories of Cycle 19, when radio propagation conditions were excellent. They were hoping for a repeat with Cycle 24, but that is clearly not the case. And Cycle 25 is currently being forecast by some to be even lower than Cycle 24, although it’s not worth putting much, if any, stock into long range solar cycle predictions. Predictions for our current cycle (24) from just a few years ago had it being as strong as, or even stronger than, the previous cycle, which is clearly not the case.

The period marked as the Maunder Minimum on the above graph was a period of extremely low solar activity around the late 17th century. Very few sunspots were noted during this time period.

While we are indeed entering the peak of a solar cycle, which means more solar flares (and more powerful flare), which can have impacts on the Earth, I believe the historical evidence shows that the doomsday scenarios proposed by many alarmists are not warranted. I would suggest checking with various websites such as http://www.spaceweather.com/ to keep track of when a solar flare has occurred. Not to panic that the end is near, but to know when to go outside and look at the Northern Lights. They can be quite beautiful.

Beating Carriers

You’ve probably heard the low frequency beat that occurs when two closely spaced carriers are present, like in this recording.

Here’s what it looks like in a waterfall, taken with a netSDR:
beating carriers

The two bright greenish lines are the carriers, one at about 1620.0076 kHz and the other around 1620.0095 kHz (and wandering around). The result of the two carriers mixing is the difference frequency, 1620.0095-1620.0076=0.0019 kHz or 1.9 Hz. The higher and wandering carrier is the local college station (it’s actually about 12 miles away), the other station is probably WDND from South Bend, IN.

In case you’re wondering, the netSDR settings were a 200 kHz bandwidth (250 kHz output rate), and a 2,097,152 FFT with a resolution of 0.12 Hz.

An Interesting Example of a Station Going Long

A fairly active pirate station the past week or so has been the “Fruitcake” station, which plays songs and sound clips related to, well, fruitcake. Hence the name. On December 20, 2011 at 2300 UTC I recorded a transmission of this station with my netSDR. What I ended up capturing was a very interesting and educational example of a station going long.

Here is a graph of the received signal strength:
Signal Strength in dBm

An S9 signal is -73 dBm, right about the received signal level at the beginning of the broadcast. There is some fading up and down, typical with shortwave radio. What’s interesting is that the change in signal strength seems to have a definite period, rising and falling every few seconds. After a few minutes, the period starts to become longer, and the amplitude of the variation also increases. About half way through the transmission, the amplitude becomes quite large. There is then one deep fade, one large increase in signal strength, and then the signal almost fades out, going down to about -95 dBm (about S4). Notice that 10 minutes ago it was S9.

Next, here is a waterfall of the recorded transmission:
Waterfall

A waterfall is a color coded representation of the signal strength of a band of frequencies over time. In this case, it shows us the signal strength from about 2300 to 2310 UTC, over a frequency range of 6900 to 6950 kHz. The blue background represents the weak background noise that is always present, in this case about -97 dBm. The brighter colors towards green represent stronger signals. We can see the station’s carrier at 6924 kHz, and the sidebands containing the audio modulation (this is an AM signal).

The change in bandwidth of the received signal about a minute and a half into the transmission is due to the audio that was transmitted, one song ended, and another sound clip, with wider audio, began.

This is an extremely educational image. We can see several things happening here:

1. The short choppy fades at the beginning of the transmission are evident.

2. As time goes on, the fades become more prominent, and we can see the increase in their period.

3. We can see the background noise levels increasing in amplitude. Look just outside the passband of the station itself, and you can see waves of increasing and decreasing background noise.

4. The fades all start at a higher frequency, and drift down to lower frequencies over time. This is a type of phenomena called selective fading, which you may have read about.

So, what is the cause of the selective fading? There are several possibilities.

One is when both ground wave and sky wave signals are being received. If there are phase differences between the two signals, they cancel out, reducing the received signal strength. Likewise, if they are in phase, they support each other, and add together, increasing the signal strength. One common example of this is with medium wave (AM broadcast) stations. When you are close to the station, the ground wave signal is extremely strong, and the sky wave is relatively weak, resulting in excellent reception with no fading. At a long distance away from the station, the ground wave is extremely weak or nonexistent, resulting in only a sky wave. Reception is weaker than the first example, but often reliable for stronger stations. This is why you can pick up AM stations over long distances at night. However, if you are at an intermediate distance, you can receive both the sky wave and ground wave. As the relative phase between them changes, you get fades. I’ve noticed this with a semi-local AM station. It has excellent reception in the daytime, but once evening approaches, reception gets very choppy. This is even before other stations begin to roll in.

I don’t think this is the cause in this case, as there should be little or no ground wave. And if there was, I would still be able to pick up the station after the band went long, since the ground wave was present. (Being HF instead of MW, the ground wave does not travel very far anyway)

Another possibility is due to propagation via both the E and F layers. In this case, it is again relative phase differences that cause the fading. I’m not sold on this scenario either, because I don’t believe the E layer would support propagation of 7 MHz signals. (E layer propagation should not be confused with sporadic E layer propagation that often causes VHF skip)

Next up, and the idea I am presently sold on, is propagation via both the F1 and F2 layers. During the daytime, when ionization is strongest, the F layer splits into two layers, the F1 at about 150-220 km and the F2 at 220-800 km. At night, the F1 layer merges with the F2 layer.

Perhaps, during the daytime, only one layer is responsible for NVIS propagation. My thought is that the F1 layer is providing the propagation, as it is the lower layer, and the first one the radio waves would interact with. Then, in the evening, when the band is going long and the F1 layer starts to dissipate allowing some radio waves to reach the F2 layer, propagation is occurring via both layers. Relative phase differences between the signals propagated by each layer cause the selective fading effects. Once the F1 layer completely dissipates, only the F2 layer is left, but it is unable to support NVIS propagation at 7 MHz.

Comments welcome and appreciated!

A comparison of three low power AM shortwave pirate transmitters

Recently shortwave free radio station Channel Z Radio conducted test broadcasts using three different transmitters, all on the same frequency with the same antenna, a half-wave horizontal dipole cut for 6925 kHz, mounted about 40 feet high. As described in a recent article, this setup should be ideal for NVIS or regional operation.

It was interesting to see how closely theory predicted real world performance for signal intelligibility and propagation. For background information, see the September 2011 articles “Signal to Noise Ratios” for which simulations were run, and the related article “How many watts do you need?”

These recordings were made with a netSDR receiver, and a 635 ft sky loop antenna. The I/Q data was recorded to disk, and later demodulated with my own SDR software, which is based on the cuteSDR code. If you hear any glitches in the audio, that’s my fault, the code is still under development.

In all cases, I used a 4 kHz wide filter on the demodulated signal. I chose 4 kHz because examining the waterfall of the received signal, that seemed to encompass the entire transmitted audio.

First up, he used a Corsette transmitter, putting out 1.1 watts:
Corsette transmitter
The average received signal strength was -90.9 dBm. This is about an S6.
This recording was made starting at 1949 UTC

Next he used a Grenade transmitter, putting out 14 watts:
Grenade transmitter
The average received signal strength was -77.0 dBm. This is about an S8 signal.
This recording was made starting at 2010 UTC

Finally he used a Commando transmitter, putting out 25 watts:
Commando Transmitter
The average received signal strength was -73.4 dBm. This is almost exactly an “official” S9 signal.
This recording was made starting at 2028 UTC

The playlists for the three transmissions included several of the same songs, so I recorded the same song for these comparisons, to be as fair as possible. Listen for yourself to decide what the differences are.

It’s also interesting to compare the received signal levels to theory. A 10 dB increase in the received signal level is expected for a 10x increase in transmitter power. In the case of the 1.1 watt Corsette and 14 watt Grenade, we have a power ratio of 14 / 1.1 = 12.7, which is 11 dB. So we expect an 11 dB difference in received signal strength. We actually had a 90.9 – 77.0 = 13.9 dB.

In the case of the Grenade vs Commando, we had a power ratio of 25 / 14 = 1.79, or 2.5 dB. We had a received power difference of 77.0 – 73.4 = 3.6 dB, very close.

Comparing the Commando and Corsette, we had a power ratio of 25 / 1.1 = 22.7, or 13.6 dB. We had a received power difference of 90.9 – 73.4 = 17.5 dB.

I went back and measured the background noise levels during each transmission, on an adjacent (unoccupied) frequency, with the same 4 kHz bandwidth. During the Corsette transmission it was -98.1 dBm. During the Grenade transmission, it was -97.8 dBm. And during the Commando transmission, it was -95.9 dBm.

So it seems the background noise levels went up as time went on, possibly due to changes (for the better) in propagation. This might explain why the measured power differences were larger than we expected from theory – propagation was getting better.

Still, it’s nice to see how close our results are to theory.

Speaking of theory, I am ran some predictions of the expected signal levels using DX ToolBox. Obviously I have no idea where Channel Z is located, nor do I want to speculate. But since this is NVIS operation, selecting any location in a several hundred mile radius produces about the same results (I played around with various locations). So I selected Buffalo, because I like chicken wings. Here are the results:

1 Watt Corsette Prediction:
1 watt calculated signal level

14 Watt Grenade Prediction:
14 watt calculated signal level

25 Watt Commando Prediction:
25 watt calculated signal level

Ignore the box drawn around the 1700z prediction, that was the time today that I ran the software. You can see that for the 1 watt case, it predicts S5, for 14 watts between S6 and S7, and for 25 watts about S7. Numbers lower but in line with what I experienced. Note that my setup uses a 635 ft sky loop antenna, which likely produces stronger received signals than estimated.

You also see that the signal strength curves upwards as time goes on, showing an increasing signal. This is also what I experienced with the increasing background noise levels, and suspected increase in received signal from Channel Z from the first to last transmission. As it got later, the signal increased. This is something I have experienced with NVIS – the signal improves, until the band suddenly closes, and the signal level suddenly drops.

My thanks to Channel Z for running these tests on three of his transmitters, I believe the results are very interesting, and shed some light on how well signals with different transmitter power levels get out, under the same conditions.

Comments welcome and appreciated!