
Version 4.3.0 of DX Toolbox, the radio propagation app for Windows and Mac OS X has been released.
This version adds the Ionosonde Plot Window. This window lets you see graphs of ionosonde data from a number of sites around the world. Select the site from the first popup menu (there are dozens of sites around the world), then select the type of graph from the second. There are three types:
foF2: This is a plot of the highest frequency that will be reflected from the F2 layer of ionosphere when transmitted straight up. As the incident angle is decreased, higher frequencies will be reflected, that is, more distant stations can be heard, or alternatively, more distant locations can receive the signal. This effect explains the “skip zone” around a transmitter site.
foEs: This is a plot of the highest frequency that will be reflected from the E layer of the ionosphere.
hmF2: This is a plot of the height of the F2 layer of the ionosphere. Along with the foF2 value, it can be used to calculate the MUF for a given path.
Here is a screenshot of what the window looks like, click on it to see it full sized:

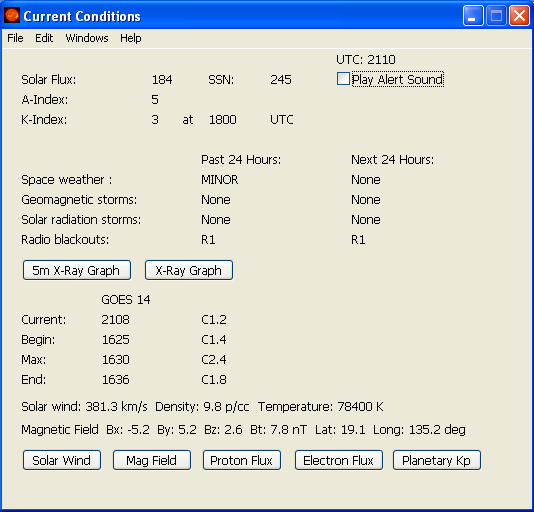
DX Toolbox also displays a variety of other information, here is the main window of current space weather:
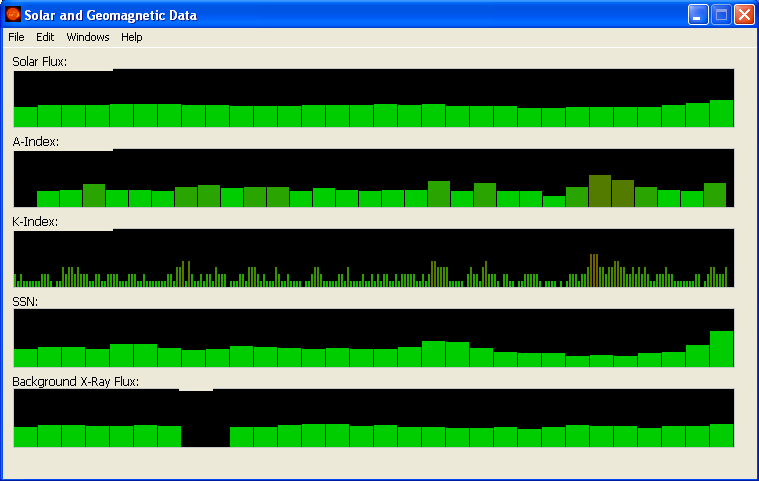
There is also this chart of recent solar and geomagnetic conditions:
Several propagation forecasting tools are also available. This one computes the MUF (maximum usable frequency) and LUF (lowest usable frequency) between two locations, as well as the estimated received signal levels:
You can read more about DX Toolbox here, and see more screenshots here.
Copies of DX Toolbox for both Windows and Mac OS X can be downloaded from the download page.
An version (minus a few features) is also available for the iPhone and iPad.