To gauge shortwave pirate radio activity in 2012, I analyzed the loggings to the HF Underground (http://www.hfunderground.com) message board. A computer script parsed the message thread titles, as well as the timestamps of the messages. This information was used to produce some statistics about the level of pirate radio activity. Of course, as Mark Twain has written: “There are three kinds of lies: lies, damned lies, and statistics.” Still, let’s see what we can learn.
There were 8683 messages posted to 2081 unique threads. Ideally, each thread represents an individual pirate station transmission. Also ideally, each message posted to a thread represents one logging. In reality, there is some error involved.
For example: the thread with the most messages, and therefore probably the most logs, and less probably the most listeners hearing it, was Wolverine Radio on October 19, 2012, with 39 messages. The numbers are slightly inflated, since a few reporters posted more than once. But it’s still a useful gauge how well heard a transmission was. If you’re interested, second place was a logging of an UNID on 3223 kHz on March 28, 2012, third place was Wolverine Radio again, on September 30, 2012, and fourth place was Pirate Radio Boston, on October 27, 2012. The UNID station had a lot of duplicate posts by individuals, which accounts for the high ranking.
The following graph shows the number of logging threads with a given number of messages:
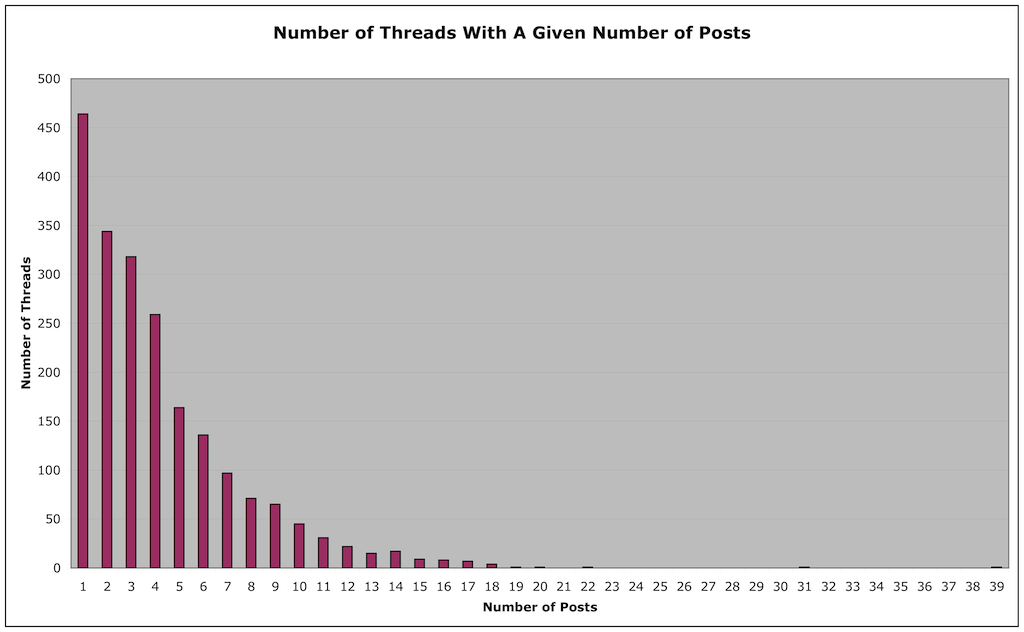
Looking at the graph, we see that there were 464 broadcasts with a single logging. 344 broadcasts had two loggings, 318 had three loggings, and so on. This tells us that the vast majority of transmissions were only reported by a small number of people. Over half were logged by three or fewer people, and three quarters by five or fewer people.
This of course does not mean that only that number of people heard the transmission. It is quite probable that the vast majority of pirate radio listeners do not log their reception reports on the HFU or any message board. Some may directly contact the station, while others listen but have little or no contact with other pirate enthusiasts or stations. Anecdotal evidence suggests there are a lot of “lurkers” in pirate radio, who may in fact be the vast majority of listeners. It is unfortunately impossible to come up with a good estimate of how large the pirate radio listening community really is.
If we assume each thread represents a unique transmission, then if we count the number of threads per pirate station, we can estimate how many transmissions they had. There are a few flaws with this method. First, it’s possible that there are some duplicate threads for a given transmission (two threads started by two listeners for the same transmission). This could inflate the estimate number of transmissions. Second, the loggings posted on the HFU represent what users heard and reported. There’s often stations that people hear but do not log, perhaps because they don’t get around to it, or because they’re not HFU users. Hang out on IRC #pirateradio for a while, and you will see many transmissions being mentioned, but never logged. This could make the estimated number of transmissions obtained by this method too low. Third, there’s also the question of what “counts” as a transmission. If a station was on for a few seconds with a test, but was logged by name, then it gets count. Finally there likely are some transmissions that no one heard, possibly due to poor propagation conditions.
Tabulating the information by station name, here are the stations with at least two or more transmissions logged on the HFU, sorted by number of transmissions (message threads):
Stations With Most Transmissions:
#1 Rave On Radio (85)
#2 Radio True North (82)
#3 Captain Morgan (81)
#4 Undercover Radio (79)
#5 Radio Ga Ga (66)
#6 Blue Ocean Radio (62)
#7 Wolverine Radio (51)
#8 Radio Ronin (49)
#9 Red Mercury Labs (42)
#10 WBNY (36)
#11 Turtlehead Radio (33)
#12 WMPR (32)
#13 XFM (23)
#14 Pirate Radio Boston (23)
#15 Renegade Radio (21)
#16 Channel Z (19)
#17 Metro Radio International (18)
#18 The Crystal Ship (18)
#19 WPOD (18)
#20 Big Boobs Radio (15)
#21 Grizzly Bear Radio (15)
#22 Voice of Captain Ron (15)
#23 Northwoods Radio (14)
#24 Toynbee Radio (14)
#25 Radio Bleh Bleh (13)
#26 MAC Shortwave (12)
#27 EAM Guy (11)
#28 Insane Radio (10)
#29 Northern Relay Service (10)
#30 Radio Free Mars Radio (10)
#31 Chamber Pot Radio (9)
#32 Liquid Radio (9)
#33 Radio 2012 International (9)
#34 Radio Free Euphoria (9)
#35 Radio Jamba International (9)
#36 Stone Circles Radio (8)
#37 WFMT (8)
#38 Eccentric Shortwave (7)
#39 All Along The Watchtower Radio (6)
#40 Appalachia Radio (6)
#41 Hot Legs Radio (6)
#42 KPZL (6)
#43 Mushroom Radio (6)
#44 PeePee Vagina (6)
#45 Radio Casablanca (6)
#46 Radio Strange Outpost 7 (6)
#47 WBOG (6)
#48 XLR8 (6)
#49 Pissant Radio (5)
#50 Radio Whatever (5)
#51 The Machine (5)
#52 WEMP (5)
#53 Ann Hoffer Live (4)
#54 CYOT (4)
#55 Radio Vixen International (4)
#56 KAOS (3)
#57 EAM Girl (3)
#58 Hard Tack Radio (3)
#59 KIPM (3)
#60 KMUD (3)
#61 WPON (3)
#62 Cool AM (2)
#63 Dit Dah Radio (2)
#64 Pandora’s Box (2)
#65 Radio Clandestine (2)
#66 Radio KEN (2)
#67 WHYP (2)
Not making this list are stations with only one transmission reported. Also, since the loggings were analyzed with a script, it is possible that
some logs were missed due to misspelling of the station name, etc.
And in reality, in #0 position way at the top, would be:
#0 UNID (534)
As you can see, there are a lot of UNID stations reported. Many of these are short test transmissions, or one or two songs played. Some are longer, full length transmissions, with either no attempt at an ID by the operator, or conditions were such that no listener was able to pull out an ID.
It’s worth pointing out, again, that these lists are based on the logs posted on the HFU. There are many reasons why a particular station’s broadcasts occurred but were not reported. The user base of the HFU is heavily centered around the Northeast and Midwest of the US. There could be transmissions from other parts of the country, particularly the West Coast, which are not being reported, because there are too few users from that region. There are also certain stations which some listeners have decided not to publicly log, for a variety of reasons.
Next, we can count the total number of loggings for each station, and see how they rank. Note that this is sensitive to duplicate posts by the same listener for a given transmission, so values for some stations can be inflated:
Stations With Most Loggings:
#1 Undercover Radio (429)
#2 Wolverine Radio (413)
#3 Captain Morgan (382)
#4 Radio True North (357)
#5 Rave On Radio (346)
#6 Radio Ronin (341)
#7 Blue Ocean Radio (288)
#8 Radio Ga Ga (229)
#9 WMPR (195)
#10 Red Mercury Labs (189)
#11 XFM (168)
#12 Turtlehead Radio (129)
#13 Renegade Radio (116)
#14 Channel Z (114)
#15 WBNY (108)
#16 Metro Radio International (96)
#17 Pirate Radio Boston (88)
#18 WPOD (74)
#19 The Crystal Ship (70)
#20 Big Boobs Radio (69)
#21 Grizzly Bear Radio (69)
#22 Radio 2012 International (62)
#23 Northwoods Radio (55)
#24 MAC Shortwave (54)
#25 Voice of Captain Ron (54)
#26 Toynbee Radio (53)
#27 EAM Guy (50)
#28 Radio Bleh Bleh (46)
#29 Liquid Radio (45)
#30 Radio Jamba International (45)
#31 Radio Free Mars Radio (45)
#32 WFMT (38)
#33 Hot Legs Radio (38)
#34 Radio Vixen International (38)
#35 Northern Relay Service (37)
#36 KAOS (34)
#37 Ann Hoffer Live (34)
#38 Radio Strange Outpost 7 (34)
#37 Mushroom Radio (33)
#40 Eccentric Shortwave (31)
#41 All Along The Watchtower Radio (31)
#42 Radio Casablanca (31)
#43 Insane Radio (29)
#44 XLR8 (28)
#45 KPZL (27)
#46 Appalachia Radio (27)
#47 Radio Whatever (27)
#48 KIPM (26)
#49 Radio Free Euphoria (26)
#50 WBOG (22)
#51 The Machine (22)
#52 Chamber Pot Radio (21)
#53 Pissant Radio (21)
#54 Hard Tack Radio (20)
#55 PeePee Vagina (20)
#56 Stone Circles Radio (19)
#57 Dit Dah Radio (15)
#56 Pandora’s Box (11)
#57 WEMP (10)
#58 WPON (10)
#59 KMUD (8)
#60 CYOT (7)
#61 WHYP (7)
#62 Radio KEN (7)
#63 EAM Girl (6)
#64 Cool AM (4)
#65 Radio Clandestine (4)
In general, the stations that transmitted the most, were reported the most. The largest exception to this rule is Wolverine Radio, which is #7 for total broadcasts, but #2 for total reception reports. Wolverine is often noted with a very strong signal, this may count for some of the larger ratio of reception reports to transmissions.
In fact, we can produce a table of the ratio of reports to transmissions for stations (with more than 10 transmissions, to reduce errors due to insufficient data). Stations with a high ratio have a lot of listeners per transmission, stations with a low ratio have few listeners per transmission:
8.10 Wolverine Radio
7.30 XFM
6.96 Radio Ronin
6.09 WMPR
6.00 Channel Z
5.52 Renegade Radio
5.43 Undercover Radio
5.33 Metro Radio International
4.72 Captain Morgan
4.65 Blue Ocean Radio
4.60 Big Boobs Radio
4.60 Grizzly Bear Radio
4.55 EAM Guy
4.50 Red Mercury Labs
4.50 MAC Shortwave
4.35 Radio True North
4.11 WPOD
4.07 Rave On Radio
3.93 Northwoods Radio
3.91 Turtlehead Radio
3.89 The Crystal Ship
3.83 Pirate Radio Boston
3.79 Toynbee Radio
3.60 Voice of Captain Ron
3.54 Radio Bleh Bleh
3.47 Radio Ga Ga
3.00 WBNY
The average ratio is 4.75.
If we look at the estimated number of broadcasts by day of week, the results are inline with what we expect, namely that the weekends are most active, with a lull during the middle of the week:
Sunday 485
Monday 205
Tuesday 174
Wednesday 173
Thursday 173
Friday 320
Saturday 551
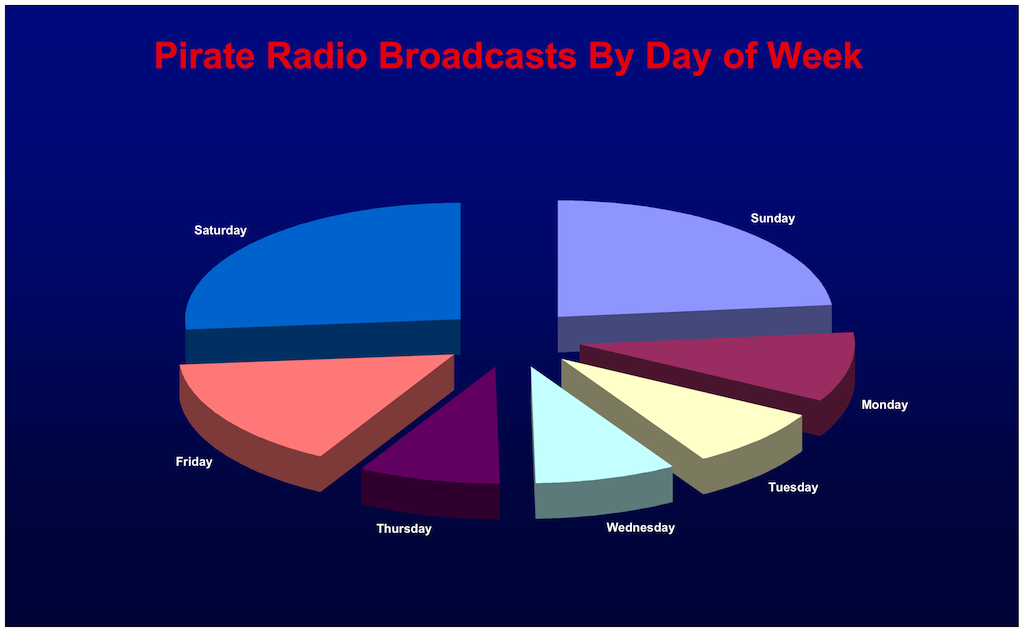
However, even the days in the middle of the week (Tuesday, Wednesday, and Thursday) have some level of pirate activity, about 3 or 4 transmissions per day. This is a very high level of activity as compared to what I remember from the 1980s and even the 1990s. Back then, weekday transmissions were much less common.
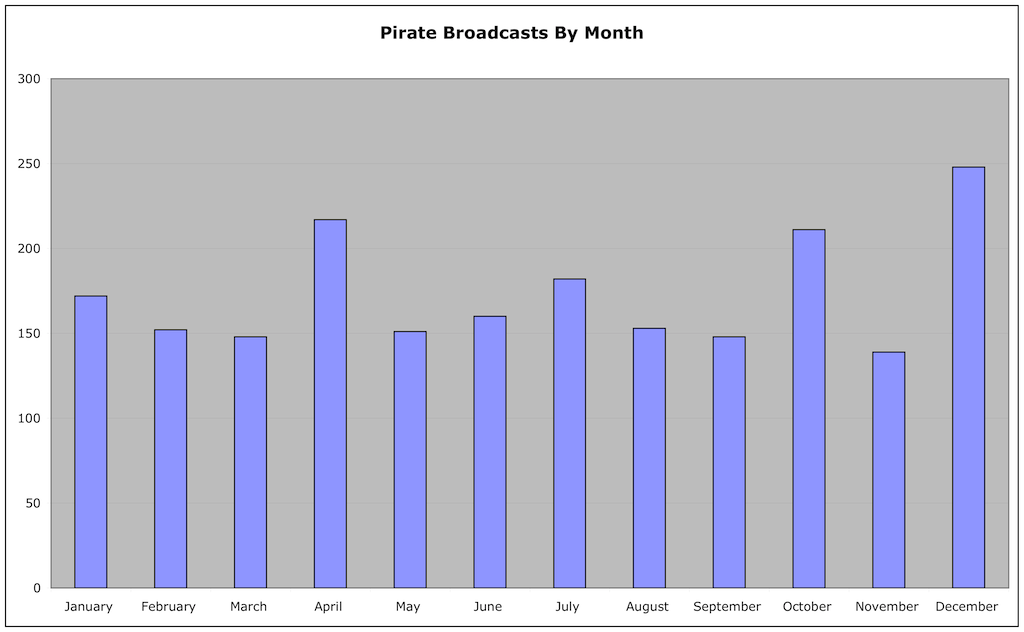
Breaking down the activity by month, we see there is some variation, with the busiest month, December (as we’d expect, with all the holidays) a little less than twice as active as the slow months in the Spring:
January 172
February 152
March 148
April 217
May 151
June 160
July 182
August 153
September 148
October 211
November 139
December 248
Looking at the transmitting modes used, AM and USB are virtually tied, with USB having a slight edge. The other modes are literally noise, with a small handful of reports. There’s a significant number of logs where no mode was reported, but it is virtually certain that either AM or USB was used:
AM 822
USB 849
LSB 21
CW 29
FM 21
SSTV 65
UNKNOWN 274
And what about the choice of transmission frequency? 6925 is the big winner, accounting for over half, and close to two thirds, of the logged broadcasts. If you add in the logs for 6924 kHz, which no doubt are pirates trying to end up on 6925 but who have a crystal or VFO that is slightly off, you end up with an even larger total. Clearly, if you can only monitor one pirate frequency, 6925 is the one:
6240 kHz: 4
6850 kHz: 5
6899 kHz: 9
6900 kHz: 12
6920 kHz: 5
6924 kHz: 82
6925 kHz: 1343
6926 kHz: 7
6927 kHz: 6
6929 kHz: 5
6930 kHz: 132
6932 kHz: 4
6933 kHz: 8
6935 kHz: 75
6940 kHz: 47
6945 kHz: 24
6949 kHz: 6
6950 kHz: 104
6951 kHz: 11
6955 kHz: 39
11428 kHz: 5
15070 kHz: 16
There are still a significant number of transmissions on other frequencies, with 6930 and 6950 being the most popular. 6955, which at one time was the most used pirate frequency in North America, is now down to 6th place, lower than the number of broadcasts by ops on 6925 kHz with a off frequency crystal.
Your comments, questions, and suggestions are greatly appreciated!
